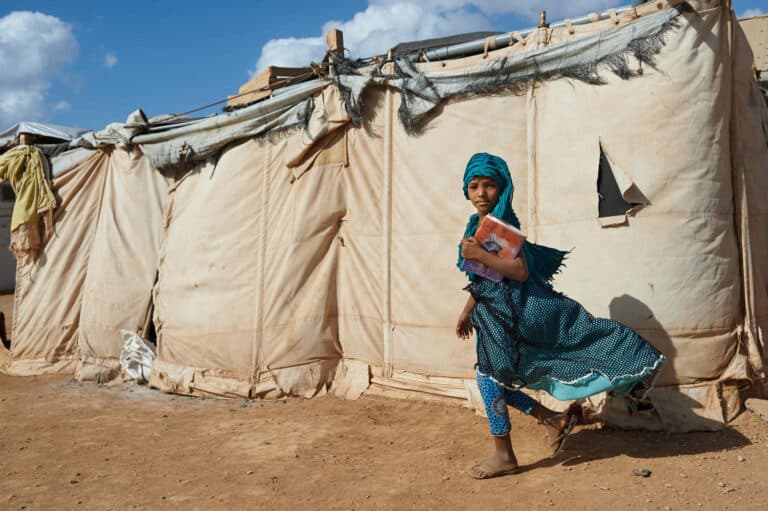
For the many people working to improve adolescents’ lives, finding data has just become a little easier.
The reason for this is UNICEF’s new Adolescent Data Portal, which launched on 18 April. For the first time, the portal brings together in one place global, regional and national-level data on adolescent well-being across key areas of their lives – health and nutrition, education and learning, protection and transition to work.
For those of us working with and for adolescents, the easy-to-navigate portal will make advocacy, programming, strategic planning, fundraising and reporting more straightforward and effective.
Integrated analysis
Until now, adolescent data have been spread across different sources, so only a limited number of people with the time, resources and expertise to dig into the data have been able to use these sources comprehensively. Through the portal, key data have been brought together, meaning more of us can access it, and by doing so, build insight to strengthen our work.
As the portal provides data across key domains of adolescent well-being, it allows for more integrated analysis. You will be able to see patterns of school completion beside data on adolescents’ entrance into the work force, for example. Seeing the evidence on what is happening across different aspects of adolescents’ lives will enable more holistic, effective responses.
Across the portal, users can view data by sex, illustrating where adolescent girls and boys have different experiences. For some subjects you can also compare results for younger and older adolescents, those in urban versus rural areas, or those in the richest and poorest families.
Making your case
If you work on national-level programmes or are a young advocate who needs robust evidence to show what is happening in your life and that of your peers, the portal will provide data to support you in making your case to officials, donors and other decision-makers. Being able to get key statistics through the portal enables us all to create more compelling, evidence-based arguments.
Exploring the data
The portal has four main sections: thematic snapshots give a worldwide overview on each domain of adolescent well-being, using data-driven narratives and simple charts to answer big questions about adolescents’ lives.
The country profiles provide a bird’s eye view of the data across the key domains of adolescent well-being. You can use this section to generate a clear summary of adolescent well-being in each country, with six graphs in each domain showing a standard selection of results that allows for easy comparison across countries.
The interactive data visualization section allows you to explore data further. Here, you can view a global map to see how a country compares to its neighbours. You can create custom charts to compare results across population groups and for your own selection of countries. And, where data allow, you can view trends over time.
Lastly, the datasets feature allows for downloads of the complete data underlying the portal.
An evolving resource
The portal’s data availability page also shows us where data are missing on a particular aspect of adolescent well-being, or for a particular populations or countries. By seeing these gaps more clearly, action can be taken to fill them – and this data can then be added to the portal, creating a fuller picture.
This is just one of the ways we envisage the portal will evolve. We welcome feedback from anyone using the portal about additional visualization tools, topics or other resources that would be useful to include. We are excited by the portal’s potential and look forward to seeing how people use it to empower themselves with the data they need to improve adolescents’ lives.
Visit the Adolescent Data Portal
To provide feedback on the portal, please email [email protected]


