
Remote sensing technologies combined with geospatial analysis enabled UNICEF and its partners to rapidly assess damage to schools in the Gaza Strip, where access to the field was limited due to conflict. The strategic use of “frontier” data technologies enabled UNICEF to improve its emergency response and prioritize relief to the children in greatest need.
Challenge: Limited access to the field
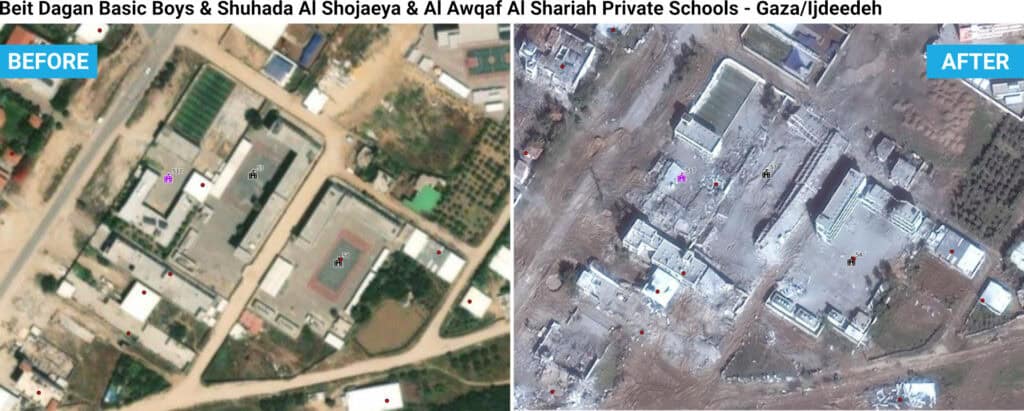
In Gaza, schools are not just a place for children to learn and grow – they’re also safe havens. Since 7 October 2023, more than 318 schools in Gaza have been functioning as shelters for displaced families and individuals (“internally displaced people” or “IDPs”), where they access food, water and essential health services. Recent hostilities in Gaza have led to a high number of attacks on schools, exacerbating a dire humanitarian situation.
In early October 2023, UNICEF, as co-lead of a coalition of education-focused NGOs in Gaza, verified the status of schools and other key infrastructure through direct observation in the field. Two weeks after the escalation, however, humanitarian workers were unable to access much of Gaza and assessing damage to schools became impossible using existing methods.
UNICEF’s State of Palestine office suddenly faced a major challenge: How do we plan and coordinate an effective humanitarian response without accurate information about the situation on the ground?
Solution: Remote sensing + geospatial analysis
The office’s Information Management Officer had become aware of the power and potential of geospatial analysis for humanitarian efforts through a prior role, but he had never used the tools himself. With support from colleagues in UNICEF’s Frontier Data Network, he quickly learned to use GIS tools and access the datasets and high-resolution satellite imagery needed to assess the condition of schools remotely.
First, the project team had to establish a baseline of the schools in Gaza. Using data from the Ministry of Education, they plotted 563 schools on a map using geographic coordinates. Instead of relying exclusively on points, and to improve the proximity analysis, they also mapped the physical footprint of each school using open-source Microsoft Building Footprints.
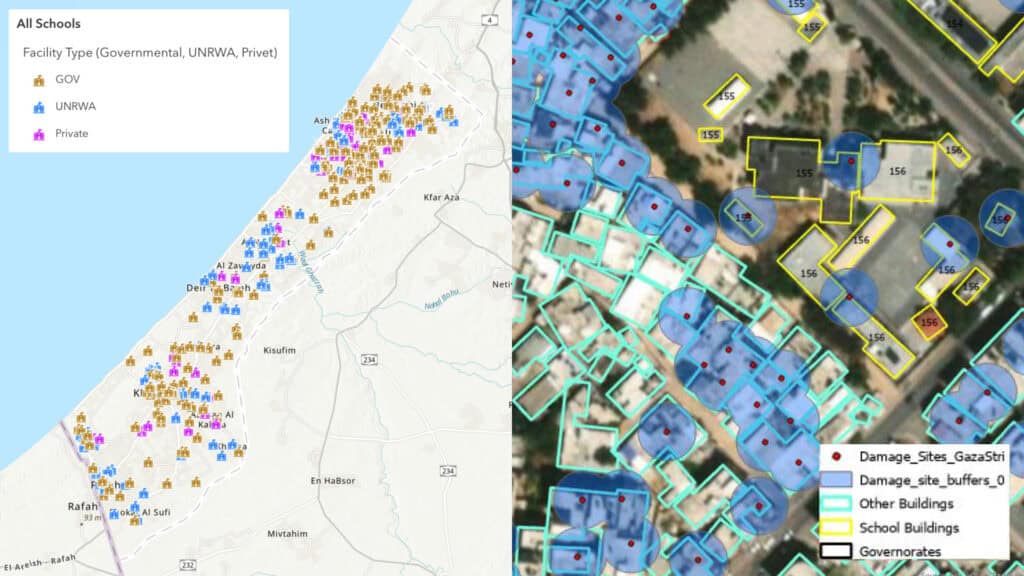
Next, they needed to estimate the level of damage at each school. With the assistance of custom code, the team calculated the distance between school buildings and known damage sites in order to classify each school’s probability of damage. Classification ranged from “direct hit,” for schools with at least one damaged structure, to “unknown,” for schools with no reported damage within 100 meters.
The assessment revealed that 162 school buildings were directly hit since 07 October 2023, or 29 per cent of all school buildings in Gaza. In February, the Gaza Education Cluster presented its findings publicly and shared its data and map layers across the UN system through OCHA, the UN’s emergency coordination office.
Impact
This project had a significant impact on the Gaza response in three crucial aspects. Firstly, it enhanced emergency response efforts by providing timely data and analysis of school damage, which improved the management and coordination of UNICEF’s humanitarian response. Secondly, by gathering accurate, real-time data on the condition of schools, it bolstered planning for reconstruction and rehabilitation, not only for schools but also for associated programs like water, sanitation, and health. Lastly, UNICEF utilized the school analysis and regularly updated dashboard to advocate for the protection of the education system in Gaza, influencing donors and member states to prioritize this critical issue.
The Damaged Schools Dashboard is dynamically updated and makes key data visible and accessible to UNICEF and other partners as soon as they are available. Kindly allow time for the dashboard to load.
What’s next?
The project team will continue to monitor damage to schools in Gaza remotely and update its analyses until the security situation allows them to conduct a comprehensive damage assessment in the field. They are also planning to publish a third version of the analysis in late April.
Beyond Gaza, this project serves as a prototype or template for other emergency response efforts in the humanitarian sector. By combining high resolution satellite imagery with geospatial analysis, emergency response teams can now assess damage to critical infrastructure and estimate the impact on populations and communities in contexts where it may be difficult or impossible to conduct similar assessments from the field.
Resources
Get started: The data and geospatial technologies and approaches discussed above are available and accessible to all UNICEF staff. Reach out via Evidence Helpdesk to get a license to ESRI GIS.
Read more: Verification of damages to schools based on proximity to damaged sites – Gaza, Occupied Palestinian Territory (25 April 2024) – occupied Palestinian territory | ReliefWeb
Technologies, data sources, and key partners
Tools:
- ArcGIS Pro, ArcGIS Enterprise (Portal) – mapping environment (enterprise license provided by UNICEF)
- Python Script with ArcGIS Toolbox UI
Datasets:
- Damage assessments (UNOSAT Damage_Sites_GazaStrip_20240107)
- Satellite imagery (Maxar)
- Boundaries (OCHA oPt)
- School facilities geolocations (Palestinian MoE)
- Building footprints (Microsoft Building Footprints)
Key collaborators:
- UNICEF’s Frontier Data Network facilitated access to cutting edge geospatial platforms, technologies, expertise
- UNOSAT provided the Damage Sites database and access to the satellite imageries, which is coordinated through UNOCHA IMU


