Child well-being
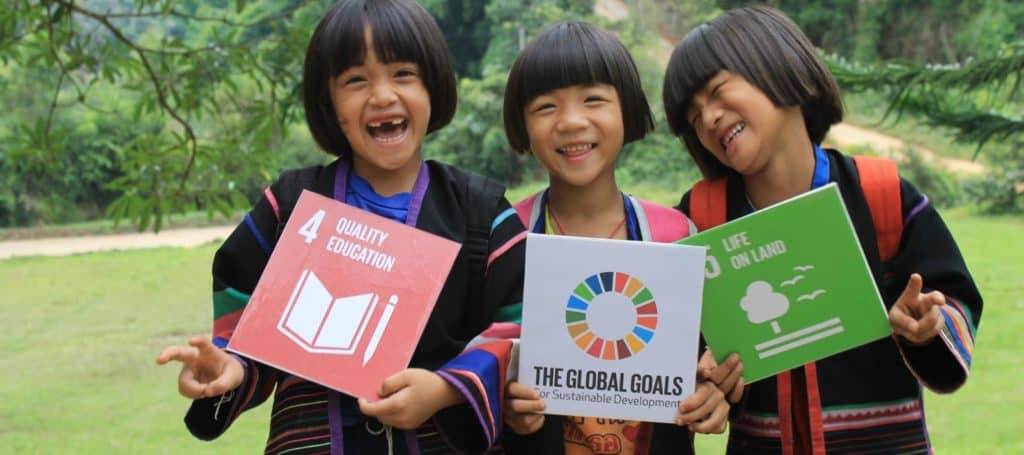
UNICEF’S commitment to data for children is guided by the fact that the SDGs impact every aspect of a child’s life. Our work is structured around 5 overarching areas of well-being for every child which are grounded in the 2030 Agenda for Sustainable Development.
This human rights-based approach pursues a vision of realizing the rights of every child, especially the most disadvantaged and responds to the call to “leave no child behind”, so that the rights of every child, everywhere, will be fulfilled.
Child-related SDG indicators
The 2030 Agenda includes 17 Global Goals addressing the social, economic and environmental dimensions of sustainable development. Attached to the Goals are 169 concrete targets measured by 232 specific indicators.
To chart and track how ambitious and how realistic country targets are, UNICEF created quantifiable country-level benchmarks for child-related indicators for which data are available to measure and monitor child rights on a common scale.
Provided below is a stocktaking of the country’s performance against the 45 child-related SDG indicators, grouping the results into five areas of child well-being to provide an overall assessment of how children are faring. The countries are evaluated using global and national targets. The analysis provides valuable insights into both historic progress – recognizing the results delivered by countries in the recent past – as well as how much additional effort might be required to achieve the child-related SDG targets. This approach provides a framework to assess ambition as well as the scale of action needed to realize it.
with data
Historic progress
- Very weak
- Weak
- Average
- Strong
- Very strong
- No trend data available
- No data
Effort needed to hit relative target
- Target met
- Very low effort
- Low effort
- Average effort
- High effort
- Very high effort
- Above recorded history
- No trend data available
- No data
- No target
Note: This dashboard uses internationally comparable data from the global databases held on behalf of the international community by UNICEF and other United Nations agencies. While UNICEF is committed to the localization of SDG targets, global rather than national targets are used to gauge progress on the SDG indicators. To read more about how the trajectories towards the global targets are assessed please read the methodology note.
Progress on Children’s Well-being: Country Briefs
At the midpoint of the 2030 Agenda for Sustainable Development how are children in countries around the world faring? Do we have enough information to know?
These country briefs leverage UNICEF’s extensive analysis of 48 child-related Sustainable Development Goal (SDG) indicators, structured around five fundamental domains of child well-being: Survive and Thrive, Learning, Protection from Harm, Safe and Clean Environment, and Life Free from Poverty. The analysis offers a detailed, multifaceted perspective on the state of children’s rights and experiences across the globe.
Population overview
Understanding of a country’s population levels, trends and projections constitutes an essential ingredient in strategic planning, policy development and program implementation for addressing global challenges and emerging issues.
Total population: 227,882,945 (2023 projections)
 Male
Male
 Female
Population Data Table
| Age Group | Male Population | Female Population | Male Percentage | Female Percentage |
|---|---|---|---|---|
| 0-4 | 16,969,740 | 16,556,885 | 7.45% | 7.27% |
| 5-9 | 16,105,703 | 15,665,981 | 7.07% | 6.87% |
| 10-14 | 14,878,846 | 14,376,560 | 6.53% | 6.31% |
| 15-19 | 12,883,975 | 12,408,766 | 5.65% | 5.45% |
| 20-24 | 10,698,260 | 10,318,032 | 4.69% | 4.53% |
| 25-29 | 8,774,685 | 8,485,134 | 3.85% | 3.72% |
| 30-34 | 7,358,852 | 7,146,990 | 3.23% | 3.14% |
| 35-39 | 6,310,333 | 6,162,859 | 2.77% | 2.7% |
| 40-44 | 5,490,496 | 5,365,611 | 2.41% | 2.35% |
| 45-49 | 4,459,764 | 4,388,858 | 1.96% | 1.93% |
| 50-54 | 3,399,898 | 3,397,046 | 1.49% | 1.49% |
| 55-59 | 2,617,176 | 2,675,632 | 1.15% | 1.17% |
| 60-64 | 1,986,092 | 2,100,111 | 0.87% | 0.92% |
| 65-69 | 1,431,817 | 1,559,297 | 0.63% | 0.68% |
| 70-74 | 929,048 | 1,040,627 | 0.41% | 0.46% |
| 75-79 | 562,401 | 618,781 | 0.25% | 0.27% |
| 80-84 | 255,893 | 290,082 | 0.11% | 0.13% |
| 85-89 | 79,047 | 96,545 | 0.03% | 0.04% |
| 90-94 | 13,709 | 19,827 | 0.01% | 0.01% |
| 95-99 | 1,159 | 2,261 | 0% | 0% |
| 100+ | 45 | 137 | 0% | 0% |
Source: United Nations Population Division, World Population Prospects 2022
Related SDG resources
At the halfway mark towards the 2030 Sustainable Development Goals, our 2023 report shows that two-thirds of child-related indicators are off-pace to meet their targets. Explore the publication for a comprehensive overview of SDGs progress.
This report provides an updated global overview of detailed progress on the implementation of the 2030 Agenda for Sustainable Development, using the latest available data and estimates in 2022.
The Division for Sustainable Development Goals at the UN Department of Economic and Social Affairs acts as the Secretariat for the SDGs, providing key support and capacity-building for the goals and their thematic issues, including water, energy, climate, and more.
UNICEF is the custodian or co-custodian of 19 global SDG indicators. In this role, UNICEF works with governments, partners, policymakers and other UN agencies to help countries ensure the goals deliver results for and with every child – now and for generations to come.