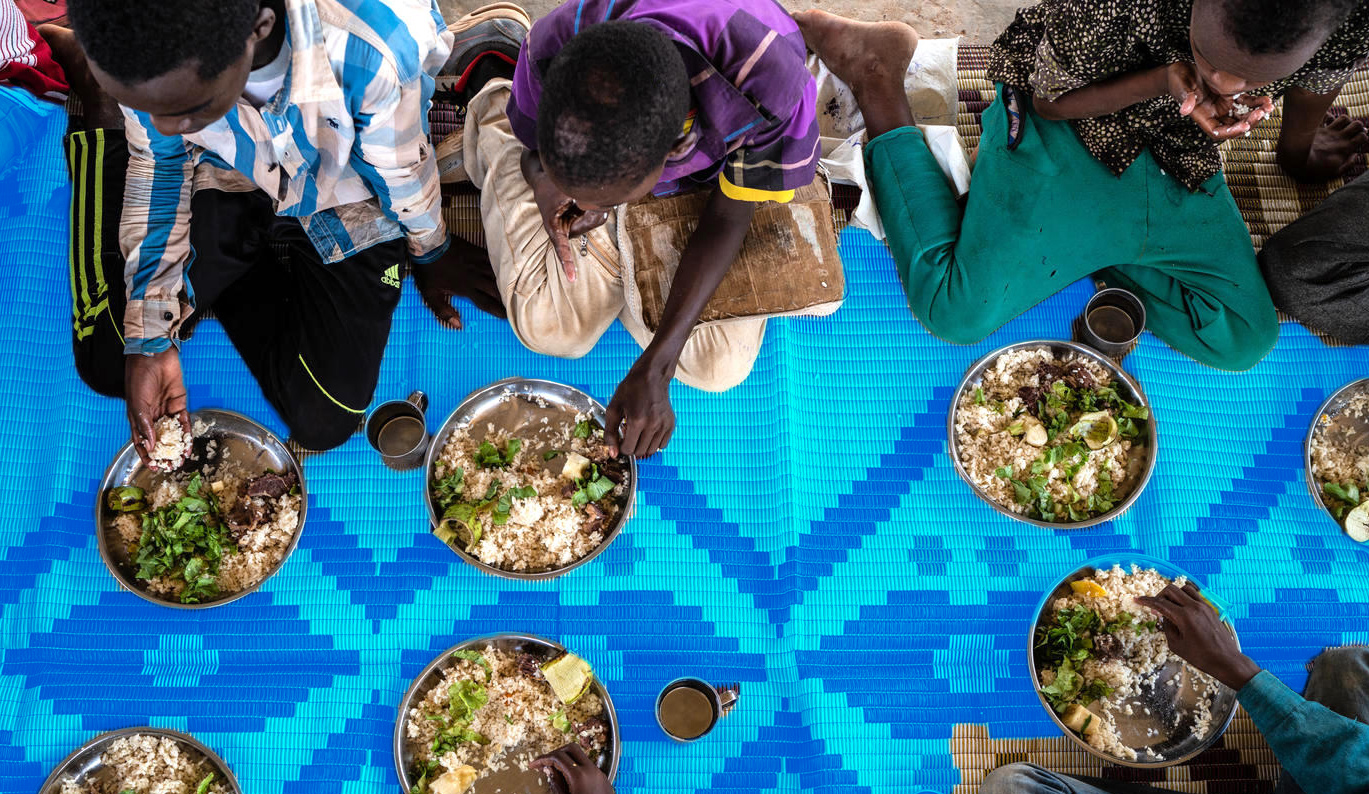
Child Malnutrition
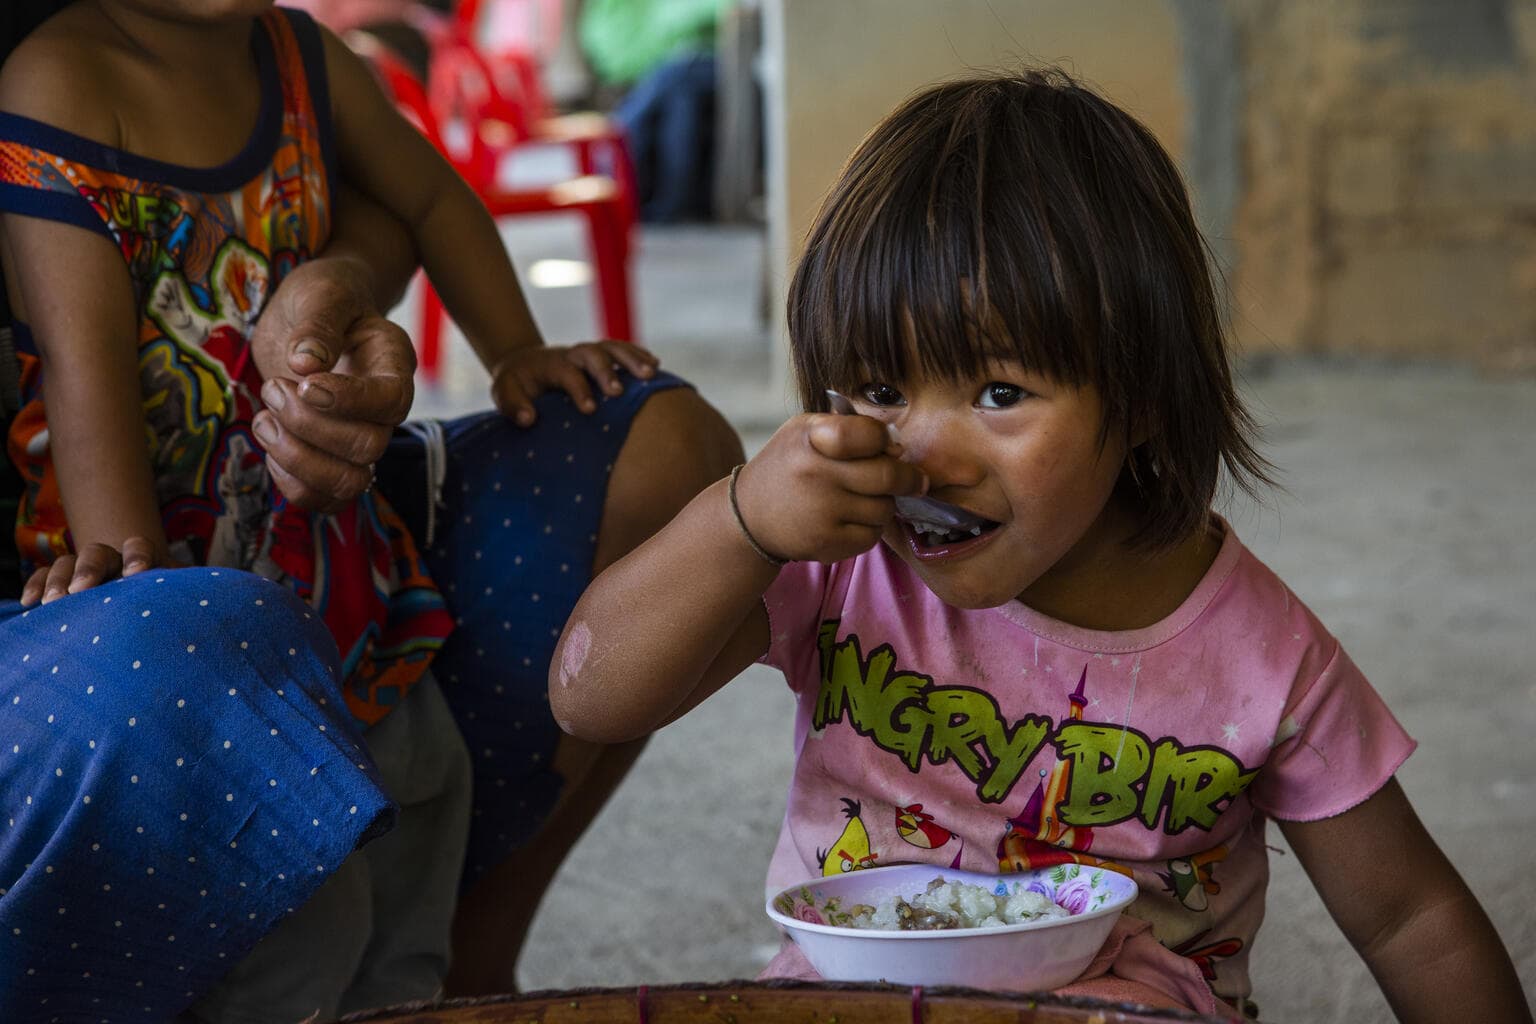
After decades of decline in stunting, new data show a worrying halt to progress. While overweight has remained unchanged, 8 million fewer children are suffering from wasting today than in 2012.
Malnutrition is a violation of children’s rights, while good nutrition sets children on the path to grow, develop, learn and reach their full potential. Despite significant progress over the past two decades, the UNICEF, WHO, World Bank global and regional child malnutrition estimates reveal that we are still far from a world without malnutrition.
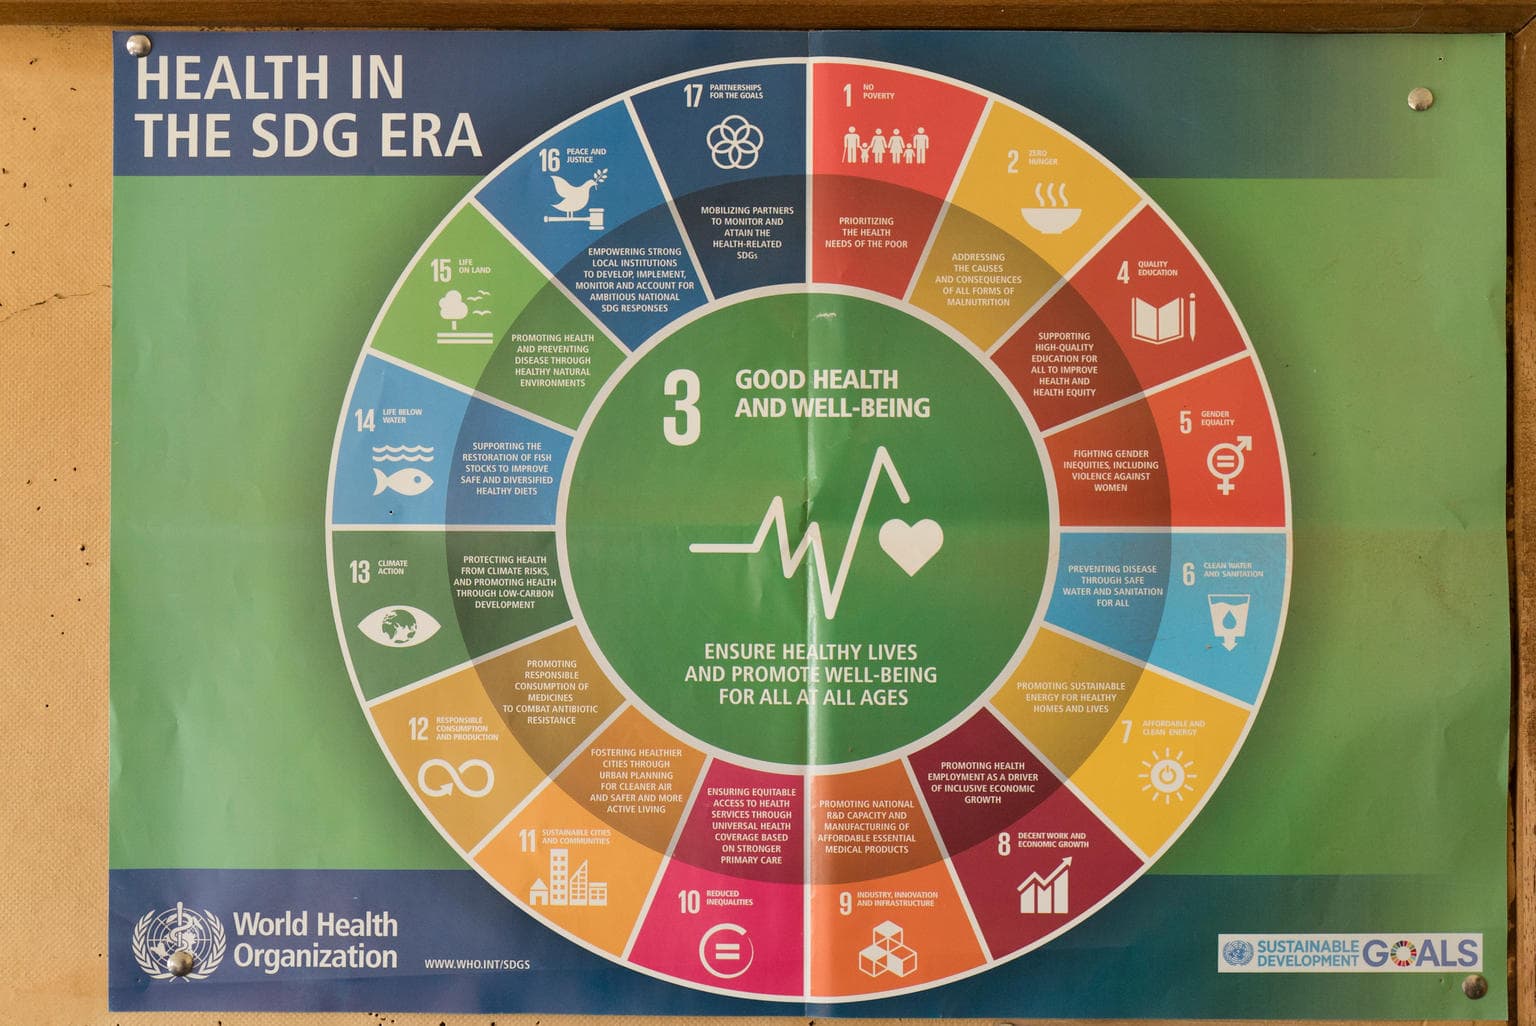
Measures of child malnutrition are used to track development progress. Estimates of child malnutrition will help determine whether the world is on track to achieve the Sustainable Development Goals – specifically, target 2.2, to “end all forms of malnutrition by 2030”, which falls under goal 2 to “end hunger, achieve food security and improved nutrition, and promote sustainable agriculture”.
Since the COVID-19 pandemic, there are less data to inform malnutrition estimates. This increases uncertainty about the progress towards reducing child malnutrition. Regular data collection is critical to monitor and analyze country, regional and global progress going forward.
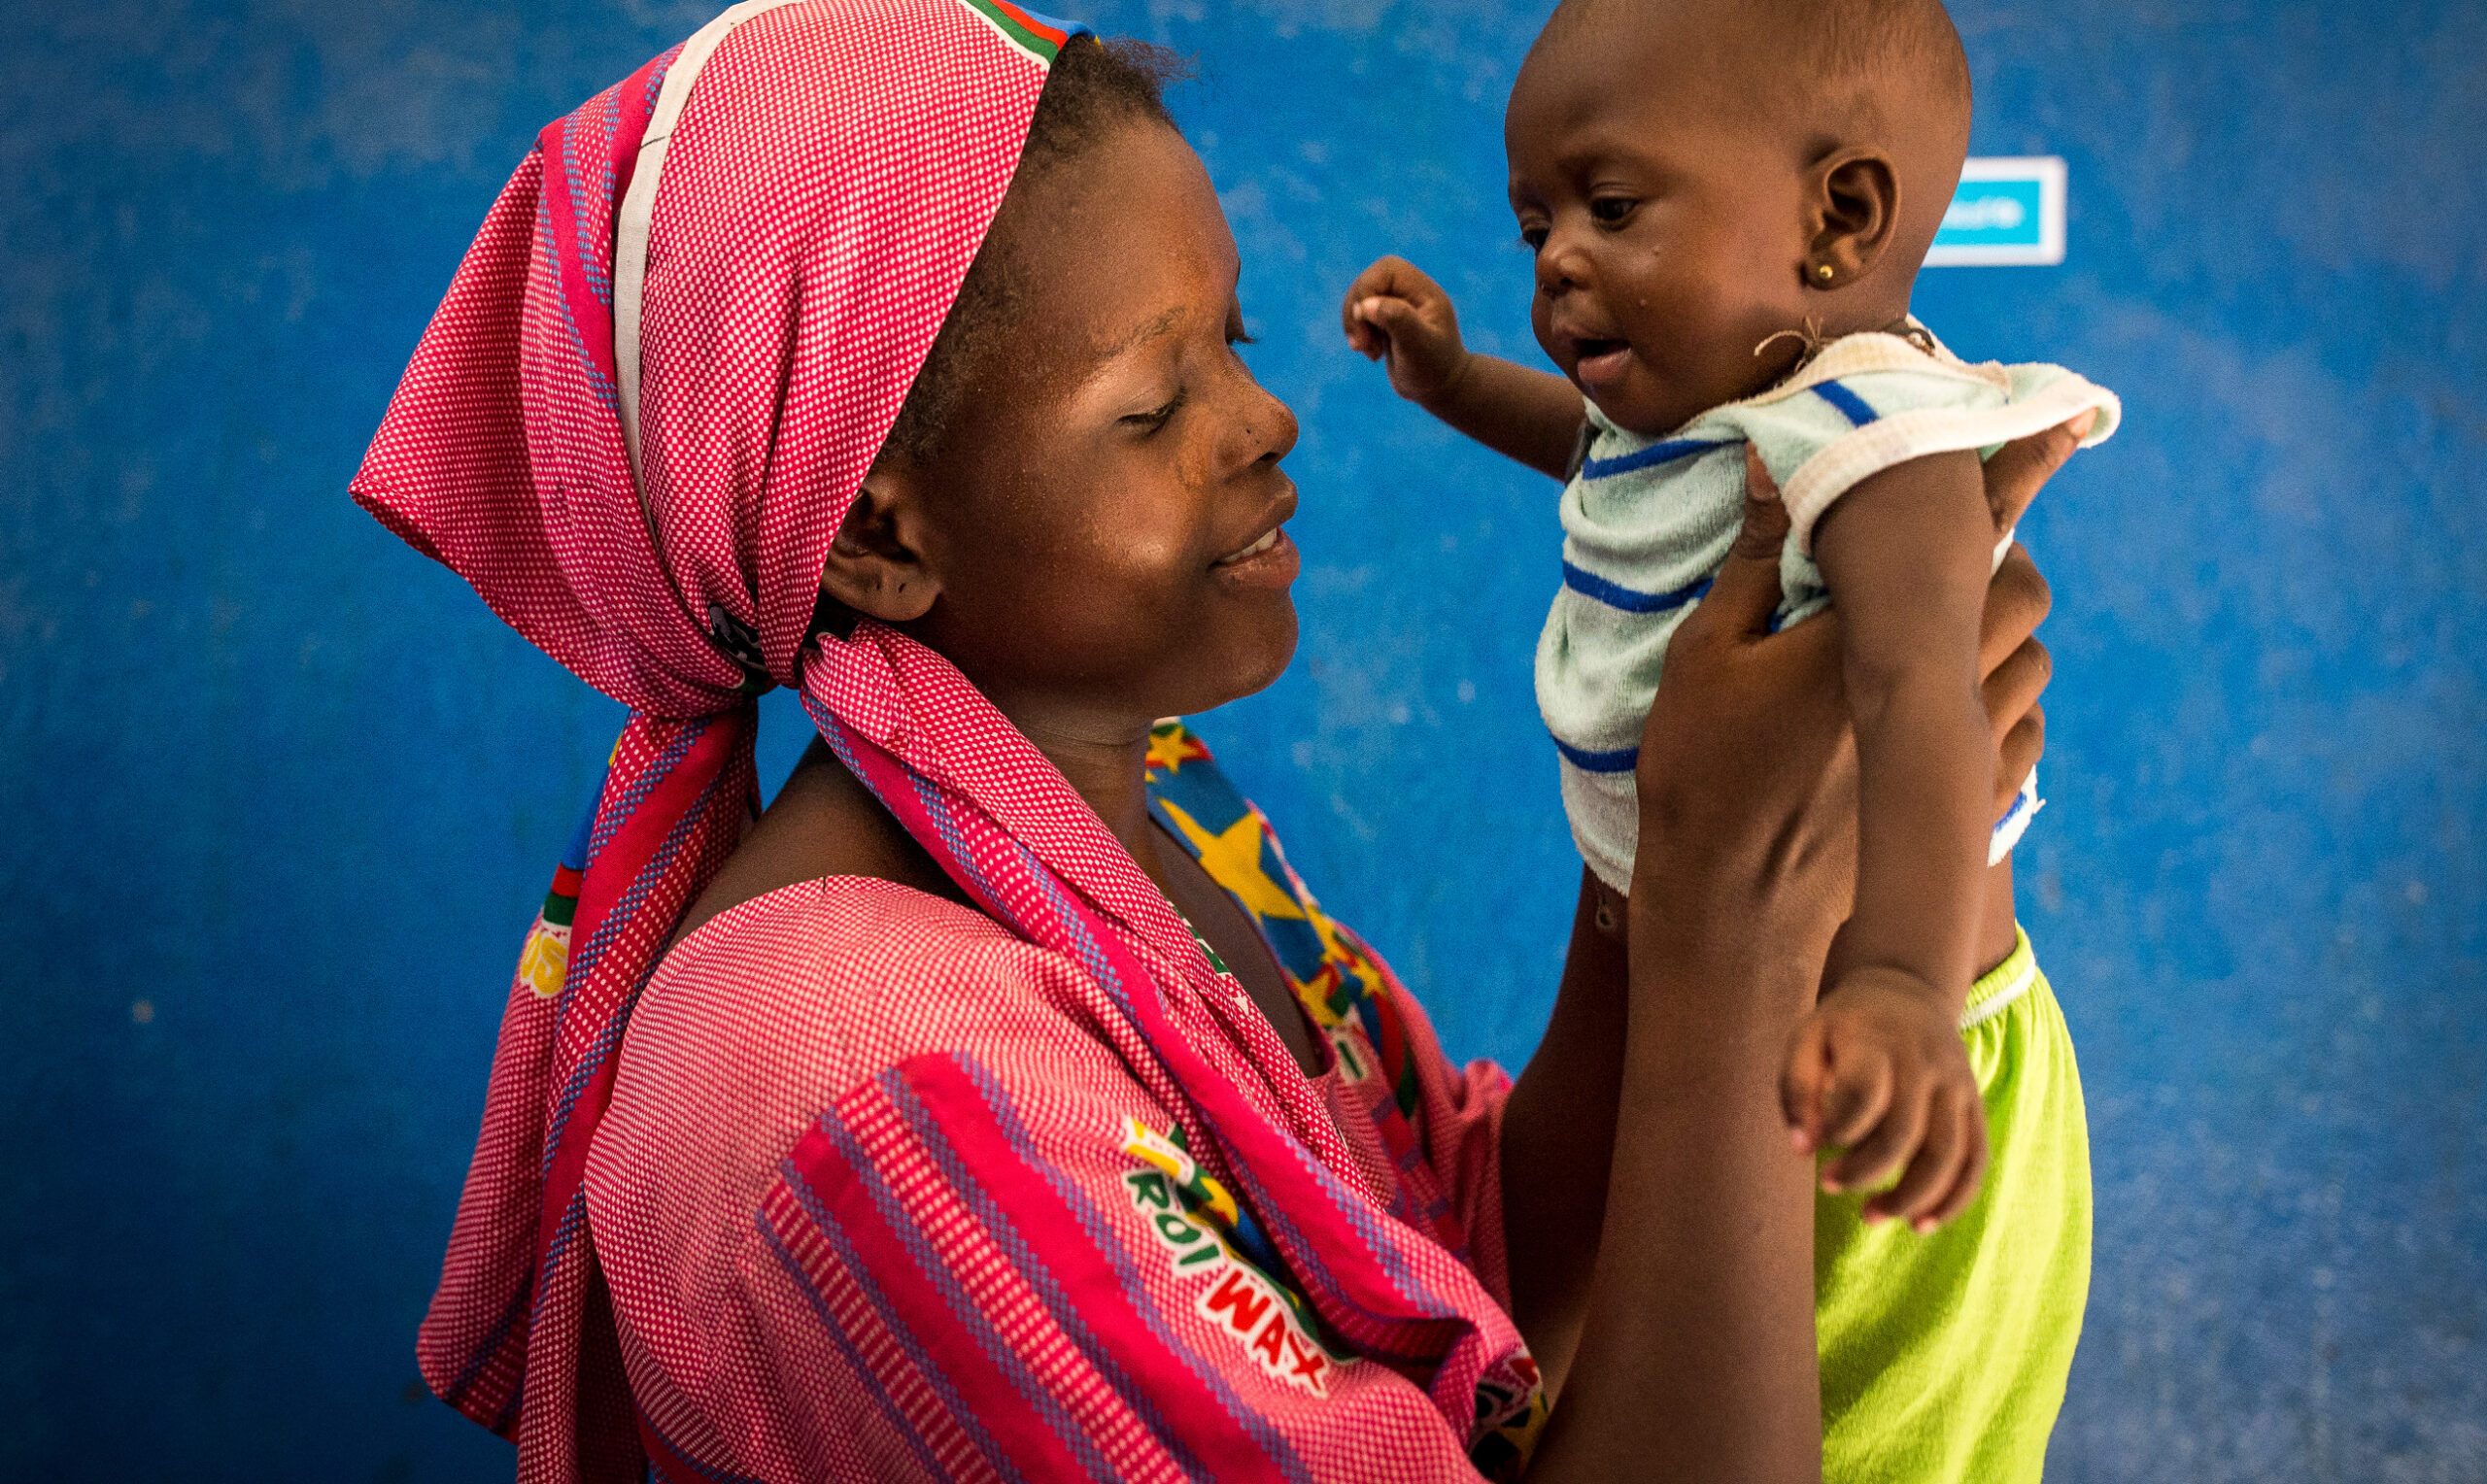
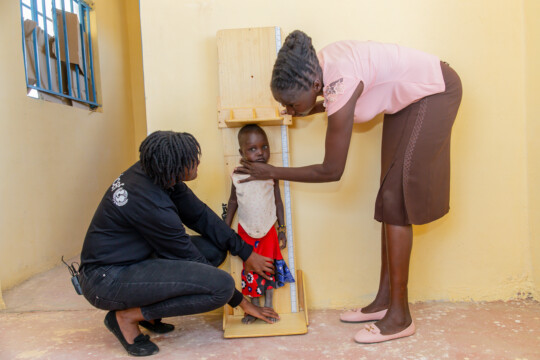
Stunting
Children affected by stunting begin their lives at a marked disadvantage: they may never attain their full possible height, and their brains may never develop to their full cognitive potential. In 2024, West and Central Africa, East and Southern Africa and South Asia had very high stunting prevalence, with approximately one third of all children affected.
Between 2012 and 2024, stunting prevalence globally declined from 26.4 per cent to 23.2 per cent. Among the regions with the highest prevalence of stunting, South Asia showed more rapid progress with stunting reduction than East and Southern Africa, and West and Central Africa.
Sub-Saharan Africa remains the only region where the number of stunted children continues to increase in both East and Southern Africa and West and Central Africa. The largest numbers of stunted children were reported in South Asia (56 million) and sub-Saharan Africa (62 million).
In 2025, JME presented for the first time, the prevalence of modelled estimates for stunting and overweight disaggregated by sex. The results show that boys are more likely to be affected by stunting than girls in all regions and globally.
Wasting and severe wasting
Globally in 2024, 6.6% of children under 5 suffered from wasting and 1.9% from severe wasting, which amounts to 42.8 million and 12.2 million children, respectively. South Asia remains the region with the highest prevalence, underscoring the need for the implementation of earlier and more effective interventions.
Children with wasting have weakened immunity, are susceptible to long term developmental delays, and face an increased risk of death, particularly when wasting is severe. The number of children affected by wasting and severe wasting reported by the Joint Child Malnutrition Estimates (JME) are prevalence-based estimates predominantly based on survey data. These estimates should be considered an underestimate of the annual burden as they do not account for the cumulative number of cases that occur throughout the year.
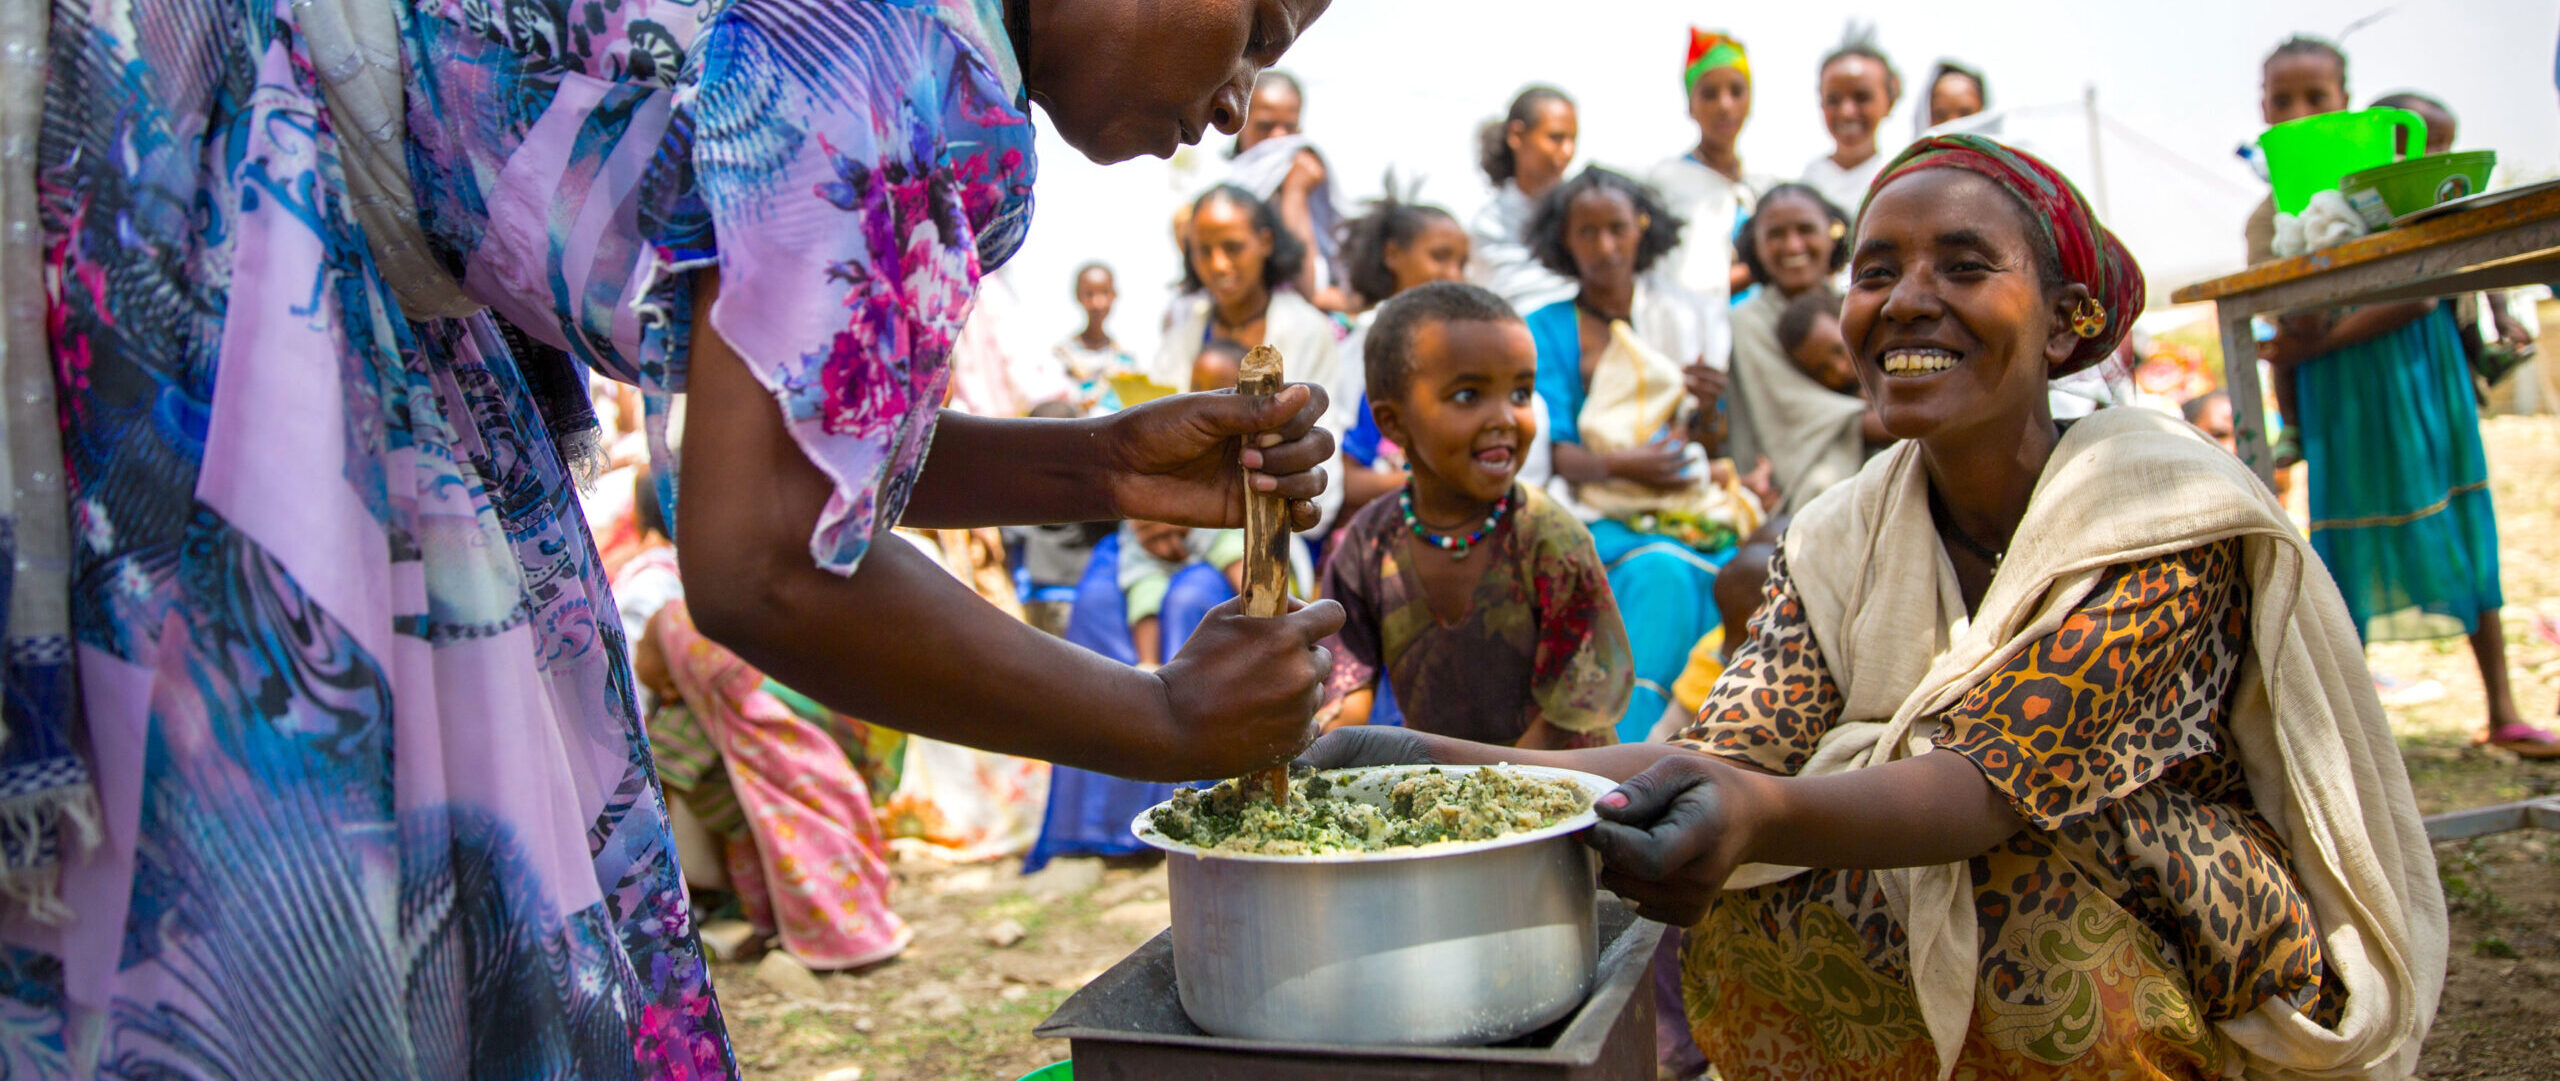
Overweight
Overweight in children under 5 is an issue in almost all regions of the world. In 2024, the prevalence of child overweight remained under 5% only in South Asia, East and Southern Africa, and West and Central Africa.
No significant progress has been made to reverse the increasing child overweight trend since 2012. Substantial increases in the prevalence of child overweight were found in East Asia and Pacific, South Asia, Latin America and Caribbean, and North America.
Between 2012 and 2024, the number of children living with overweight significantly increased in the regions of South Asia, East and Southern Africa, West and Central Africa, Latin America and Caribbean.
In 2025, the prevalence of modelled estimates for overweight disaggregated by sex are provided. These new data show that overweight is more common in boys than girls in all regions and sub-regions, but the differences are insignificant.
References
United Nations Children’s Fund (UNICEF), World Health Organization (WHO), International Bank for Reconstruction and Development/The World Bank. Levels and trends in child malnutrition: UNICEF / WHO / World Bank Group Joint Child Malnutrition Estimates: Key findings of the 2025 edition. New York: UNICEF and WHO; 2025.
Nutritional status
Malnutrition data
Build and download your own customisable dataset
Resources

Notes on the data
Indicators
|
Indicator name |
Definition |
||
|---|---|---|---|
|
Numerator |
Denominator |
Plain language definition |
|
| Stunting | Number of children under five years of age with height for age z-scores below minus 2 standard deviations (moderate and severe) and minus 3 standard deviations (severe) from the median height-for-age of the reference* population | Number of children under five years of age in the surveyed population | Stunting refers to a child who is too short for his or her age. These children can suffer severe irreversible physical and cognitive damage that accompanies stunted growth. The devastating effects of stunting can last a lifetime and even affect the next generation. |
| Wasting | Number of children under five years of age with weight for height z-scores minus 2 standard deviations (moderate and severe) and minus 3 standard deviations (severe) from the median weight-for-height of the reference* population | Number of children under five years of age in the surveyed population | Wasting refers to a child who is too thin for his or her height. Wasting is the result of recent rapid weight loss or the failure to gain weight. A child with moderate or severe wasting has an increased risk of death, but treatment is possible. |
| Overweight | Number of children under five years of age with weight for height z-scores above 2 standard deviations from the median weight-for-height of the reference* population | Number of children under five years of age in the surveyed population | Overweight refers to a child who is too heavy for his or her height. This form of malnutrition results from energy intakes from food and beverages that exceed children’s energy requirements. Overweight increases the risk of diet-related noncommunicable diseases later in life. |
*The reference population is based on the WHO Child Growth Standards, 2006
Please note that some children can suffer from more than one form of malnutrition – such as stunting and overweight or stunting and wasting. There are currently no joint global or regional estimates for these combined conditions, but UNICEF provides a country-level dataset with country level estimates, where re-analysis was possible.
WHO Child Growth Standards 2006 (reference population)
The prevalence of children under 5 affected by stunting, wasting and overweight is estimated by comparing actual measurements to an international standard reference population. In April 2006, the World Health Organization (WHO) released the WHO Child Growth Standards, which replaced the National Center for Health Statistics (NCHS)/WHO reference population, which was based on a limited sample of children from the United States of America. The WHO 2006 standards were the result of research involving more than 8,000 children from Brazil, Ghana, India, Norway, Oman and the United States. Overcoming the technical and biological drawbacks of the old reference population, the WHO 2006 standards confirmed that children born anywhere in the world and given the optimum start in life have the potential to reach the same range of height and weight. The research demonstrated that differences in children’s growth until the age of 5 years are more influenced by nutrition, feeding practices, environment and health care than by genetics or ethnicity.
Explanation why national trends are shown for stunting and overweight but only most current national estimate are presented for wasting and severe wasting:
Wasting (or acute malnutrition) is a relatively short-term condition but is a predictor of child mortality and increased susceptibility to stunting, as well as future episodes of wasting. Although it is rare, an individual child can be affected by wasting more than once in a calendar year.
In countries where populations have stable access to healthy diets, health care, safely managed water and sanitation and basic hygiene facilities, there is little to no seasonal variation in wasting. Studies reveal that in countries with high burdens of wasting, the prevalence of wasting can double between cool and hot/rainy seasons.[1] [2] This is confirmed by most of the longitudinal cohort data from 21 lower- and middle-income countries.[3]
The JME prevalence of wasting and severe wasting are based on national level estimates mostly from cross-sectional surveys. These surveys can be collected over several seasons or even years. Due to the complexity of planning and implementing national surveys, most data sources included in the JME database are not able to address the risk of seasonal bias. The prevalence of wasting is representative of the time period of data collection and does not reflect the number of cumulative cases (incidence) of wasting occurring over a defined time period, like a month or a year.[4]
The lack of incidence data for wasting and severe wasting is a main reason why the JME does not present annual national trends for acute malnutrition. Since the prevalence data are collected infrequently (every 3 to 5 years) in most countries, it is not possible to capture the fluctuations in wasting over the course of a year or to account for variations by season across survey years. In contrast, stunting and overweight are relatively stable or have a low prevalence over the course of the calendar year, allowing the calculation of trends in these two conditions over time with prevalence data.
For the reasons above, the calculation of the number of children affected by wasting or severe wasting cannot accurately calculated with the equation of population times prevalence. Therefore, the JME reported global estimates of the number of children under 5 affected by wasting and severe wasting likely underestimate the true number of children affected and in need of treatment each year.
For more information on the JME standard methodology, please see
https://data.unicef.org/resources/jme-standard-methodology/
Footnotes
[1] Helen Keller International / Institute of Public Health Nutrition (2006a). Trends in child malnutrition, 1990 to 2005: Declining rates at national level mask inter-regional and socioeconomic differences. Nutrition Surveillance Project Bulletin No. 19. Dhaka: Helen Keller International/Bangladesh.
[2] Johnston R, Dhamija G, Kapoor M, Agrawal PK, Wagt A. Methods for assessing seasonal and annual trends in wasting in Indian surveys (NFHS-3, 4, RSOC & CNNS). PLoS One. 2021 Nov 22;16(11):e0260301. doi: 10.1371/journal.pone.0260301.
[3] Mertens, A., Benjamin-Chung, J., Colford, J.M. et al. Child wasting and concurrent stunting in low- and middle-income countries. Nature 621, 558–567 (2023). https://doi.org/10.1038/s41586-023-06480-z
[4] Isanaka S, Andersen CT, Cousens S, et al Improving estimates of the burden of severe wasting: analysis of secondary prevalence and incidence data from 352 sites BMJ Global Health 2021;6:e004342.