Vitamin A
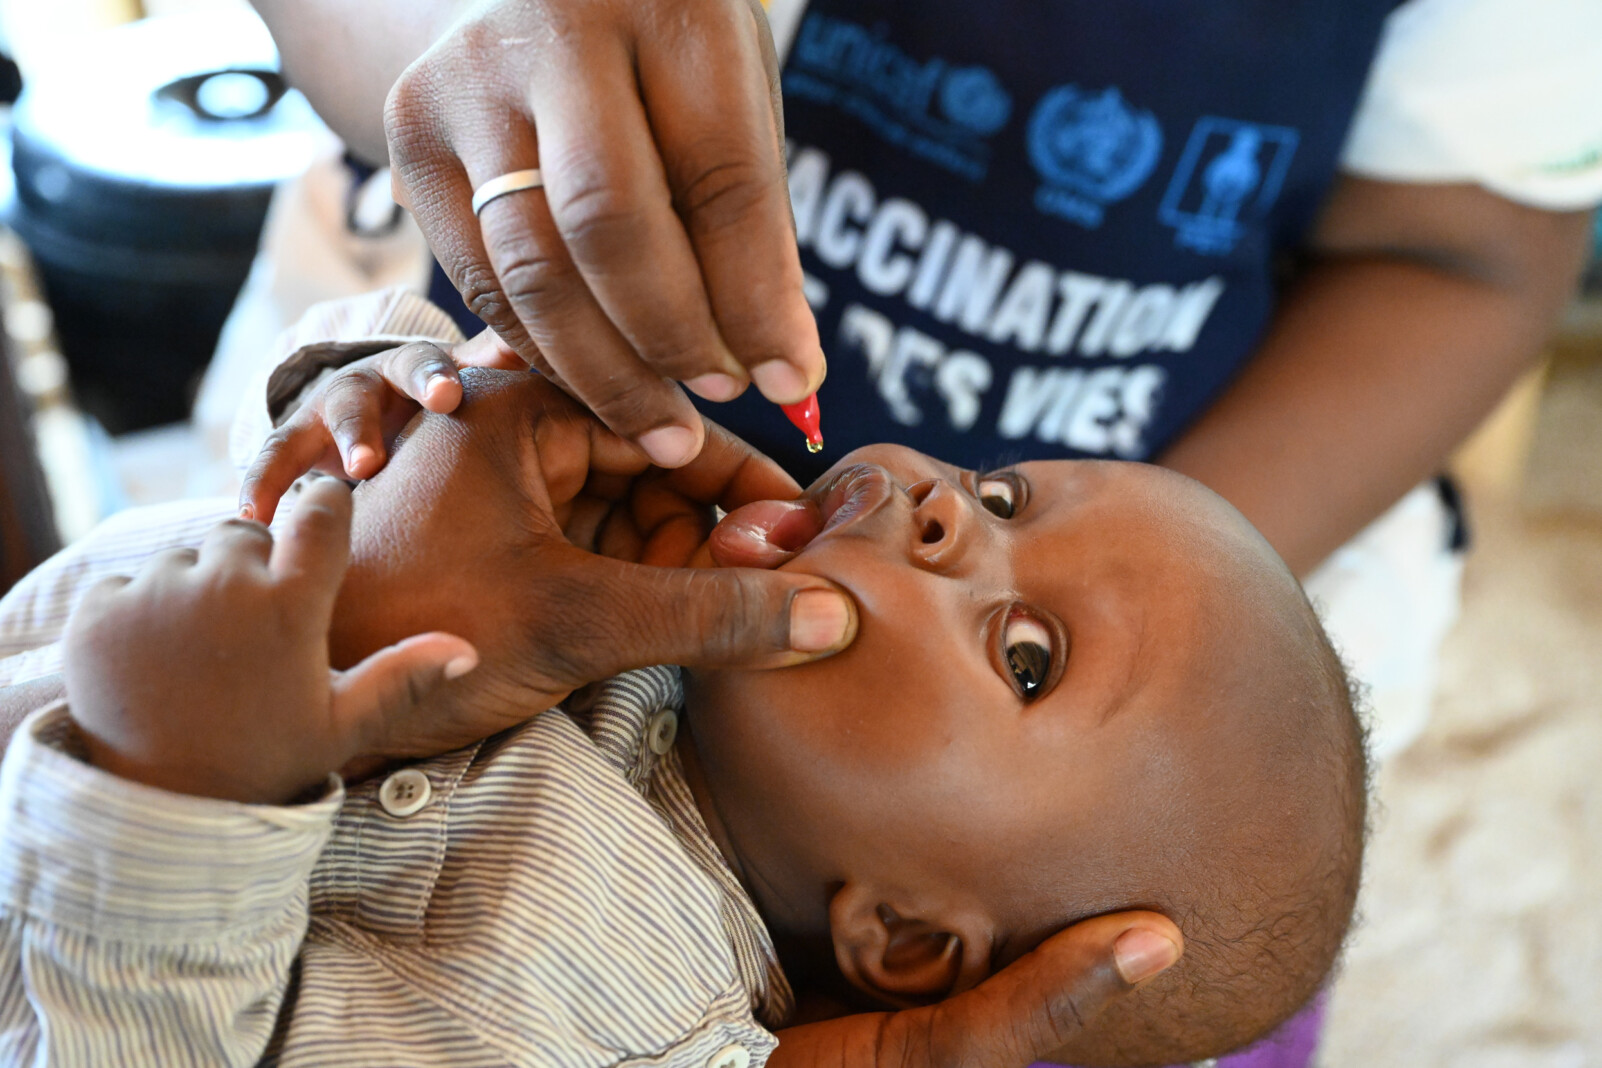
In 2023, three out of four children who needed it received the recommended two high-dose vitamin A supplements to help protect their health
Vitamin A deficiency is the leading cause of preventable childhood blindness and increases the risk of death from common childhood illnesses such as diarrhoea. Periodic, high-dose vitamin A supplementation is a proven, low-cost intervention [1] which has been shown to reduce all-cause mortality by 12 to 24 per cent [2], and is therefore an important programme in support of efforts to reduce child mortality. The World Health Organization classified vitamin A deficiency as a public health problem affecting about one third of children aged 6 to 59 months in 2013, with the highest rates in sub-Saharan Africa (48 per cent) and South Asia (44 per cent).
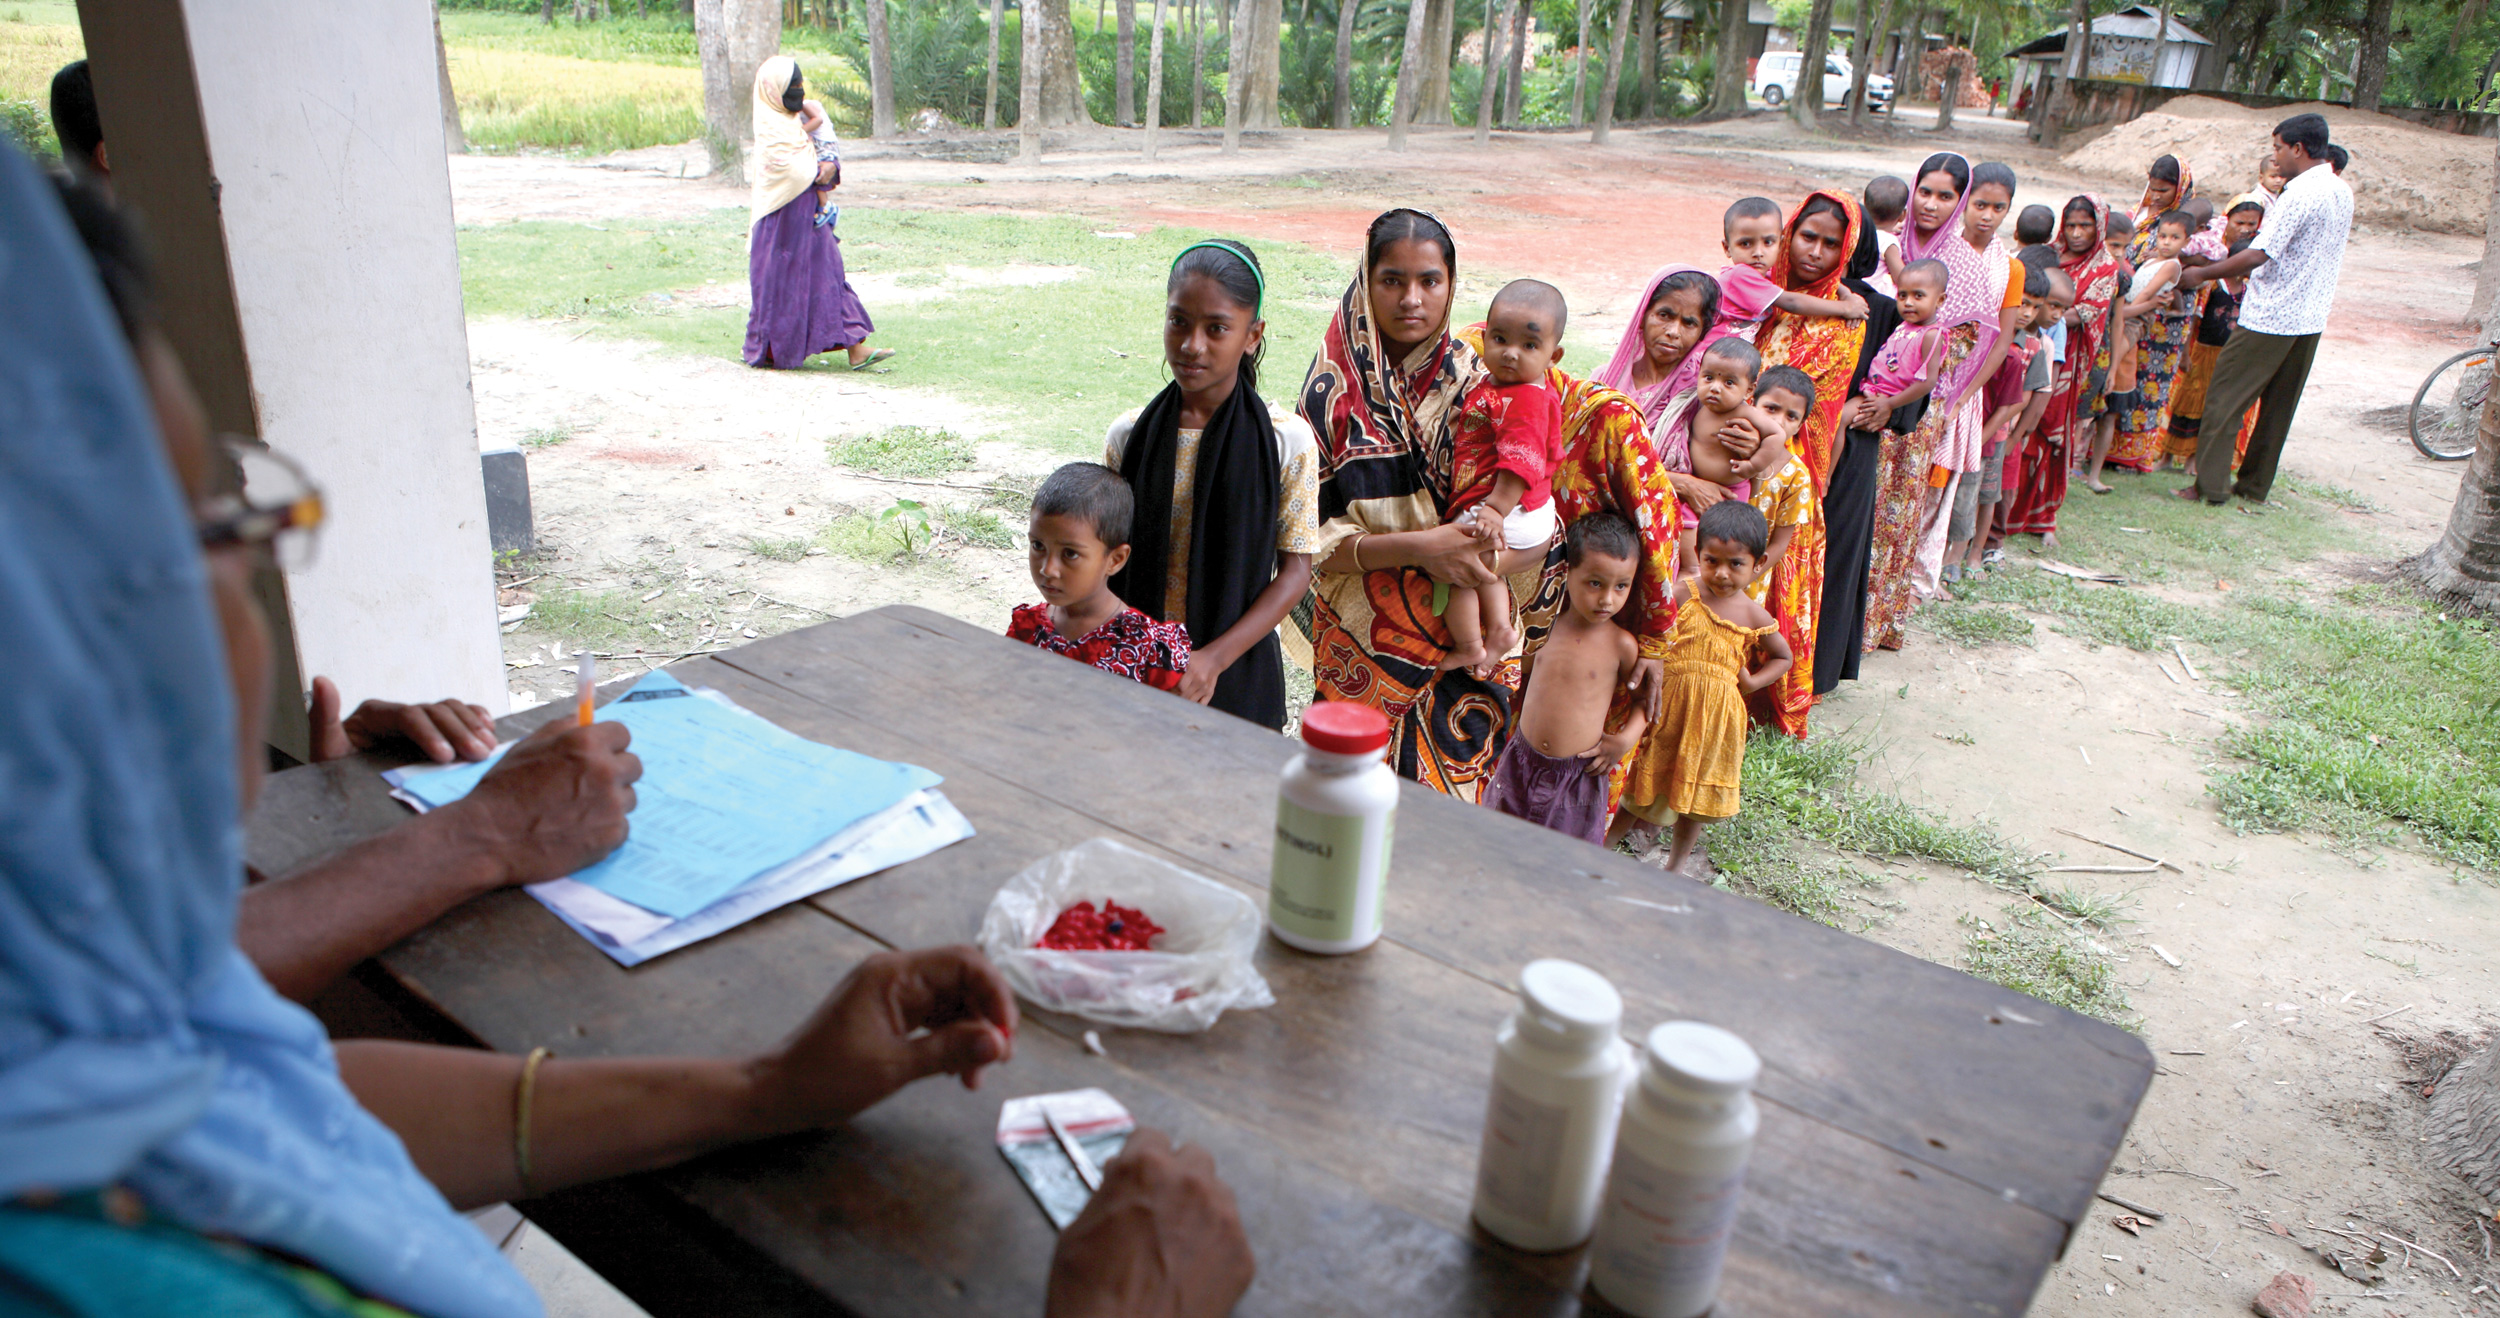
75 per cent of targeted children were reached with this key child survival intervention in 2023, with South Asia and West and Central Africa achieving the highest coverage, at 83 percent. Of 64 countries deemed ‘priorities’ [3] for national-level vitamin A supplementation programmes, 51 had two-dose coverage estimates available for 2023. A total of 20 countries achieved two-dose coverage of 80 per cent or more in 2023. Future efforts will need to focus on strengthening systems so that more children can be protected.
References and footnotes
[1] See UNICEF’s micronutrient pages for more information.
[2] Imad et al. (2011) Vitamin A supplementation for preventing morbidity and mortality in children from 6 months to 5 years of age. The Cochrane Collaboration and published in The Cochrane Library 2011, Issue 1.
[3] The current UNICEF Global VAS Coverage Database 2000–2020 includes 64 countries identified as “priority” for current national VAS programming. The priority country list for 2000-2017 included 82 countries but was reduced to 64 as of the 2018 reporting year. Countries requiring only sub-national programmes are not included among priority countries or in the database. The lists of countries can be found on this webpage under the heading of “Access the data”.
Access the data
Vitamin A data
Build and download your own customisable dataset
Resources

Notes on the Data
1. Guidelines for monitoring vitamin A supplement coverage
Guidelines from the Global Alliance for Vitamin A (GAVA) provide guidance for and information for district-level managers and national-level managers on country-level monitoring and reporting of vitamin A supplementation programmes targeted at 6- to 59-month-old children.
2. Processes for the UNICEF Global VAS Coverage Database
Since 2000, UNICEF has estimated VAS coverage in priority countries1 at national, regional and global levels as part of organization-wide efforts to monitor the situation of children worldwide. A report which describes the process, rules and assumptions applied to the administrative data received each year from country teams for generation of the UNICEF Global VAS Coverage Database was released in March 2020. The report includes a flow chart that provides a quick snapshot of the overall review process as well as a detailed account of review questions, different scenarios encountered and how each is addressed. Summaries of 2.1. Indicators for the UNICEF Global VAS Coverage Database; and 2.2. Process to generate annual national VAS coverage estimates for the database are provided below with full details available in the report.
2.1. Indicators for the UNICEF Global VAS Coverage Database
Table 1. Indicator definitions for vitamin A supplementation coverage in the UNICEF Global Database
| Indicator name | Indicator definition | Numerator | Denominator |
| 1 Semester 1 VAS Coverage (January to June) | Percentage of children 6–59 months of age who received an age appropriate dose of vitamin A in semester 1 through the main distribution mechanism* | Number of children aged 6–59 months that received an age appropriate dose of vitamin A through the main distribution mechanism* in semester 1 | Total population of children aged 6–59 months |
| 2 Semester 2 VAS Coverage (July to December)
|
Percentage of children 6–59 months of age who received an age appropriate dose of vitamin A in semester 2 through the main distribution mechanism* | Number of children aged 6–59 months that received an age appropriate dose of vitamin A through the main distribution mechanism* in semester 2 | Total population of children aged 6–59 months |
| 3. Annual two-dose VAS coverage (takes Semester 1 and 2 into account) | The semester which achieved the lower VAS coverage for children aged 6-59 months in a given calendar year | Number of children aged 6–59 months that received an age appropriate dose of vitamin A through the main distribution mechanism* in the semester with the lower coverage in the calendar year | Total population of children aged 6–59 months used to estimate coverage for the semester with the lower coverage value for the calendar year |
*Defined as the mechanism that achieved the highest coverage in the semester.
Two-dose VAS coverage is the main indicator for global monitoring of VAS programmes. Two-dose VAS coverage is an estimate of the percentage of children aged 6–59 months who received two doses of VAS spaced about 4 to 6 months apart in a calendar year. The semester which achieved the lower coverage between semester 1 and semester 2, is used as a proxy (e.g. if semester 1 achieved 98 per cent coverage and semester 2 achieved 50 per cent coverage, the two-dose coverage is reported as 50 per cent). In cases where there are only data for one of the two annual semesters (i.e. the other semester did not have any data or did not have an approved coverage estimate), the two-dose coverage is reported as “no data”. In cases where more than 8 months has occurred between the event in semester 1 and semester 2, the two-dose coverage is reported as 0 per cent.
Although international recommendations call for vitamin A supplementation every four to six months, current monitoring efforts are unable to capture the proportion of children covered who are receiving both annual doses of vitamin A with appropriate spacing. Approximations of two-dose coverage reported by UNICEF assume that in countries providing more than one round of supplementation, the same children are probably bypassed in both distributions. The assumption is that the proportion of children reached by one campaign but not by the other would be minimal. Therefore, the lower of two coverage data points for a given year is assumed to be roughly equivalent to the proportion of children receiving two appropriately spaced doses of vitamin A. There is a need to develop more refined methods for measuring the proportion of children fully protected.
2.2. Process to generate annual VAS coverage estimates for the database
Country teams are asked to fill in a standardized form for annual VAS coverage reporting. The processes, standards and assumptions used to generate national coverage estimates based on data submitted by the country teams are summarized in a flow chart. The specific steps outlined in the flow chart from the point of data submission to determination of the final national coverage estimate for each semester are described in the report. This includes the questions that are asked in the review, the different scenarios encountered, and how different challenges are addressed.
[1] The UNICEF Global VAS Coverage Database 2000–2017 includes 82 countries identified as “priority” for national VAS programming as of the year 2000. The list was based on a data-driven exercise undertaken in 2014, utilizing estimates of health and nutrition indicators around 2000, when VAS programmes were typically initiated. The two main indicators considered in the exercise were (i) under-five mortality rate and (ii) VAD prevalence. Informed by this analysis, the set of countries for which semester-wise and annual two-dose VAS coverage estimates are reported on in the UNICEF global database has been restricted to these countries. This list was reduced to 64 priority countries as of the 2018 reporting year. Countries requiring only sub-national programmes are not included in the database. The lists of countries can be found on this webpage under the heading of “Access the data”.