Drinking water
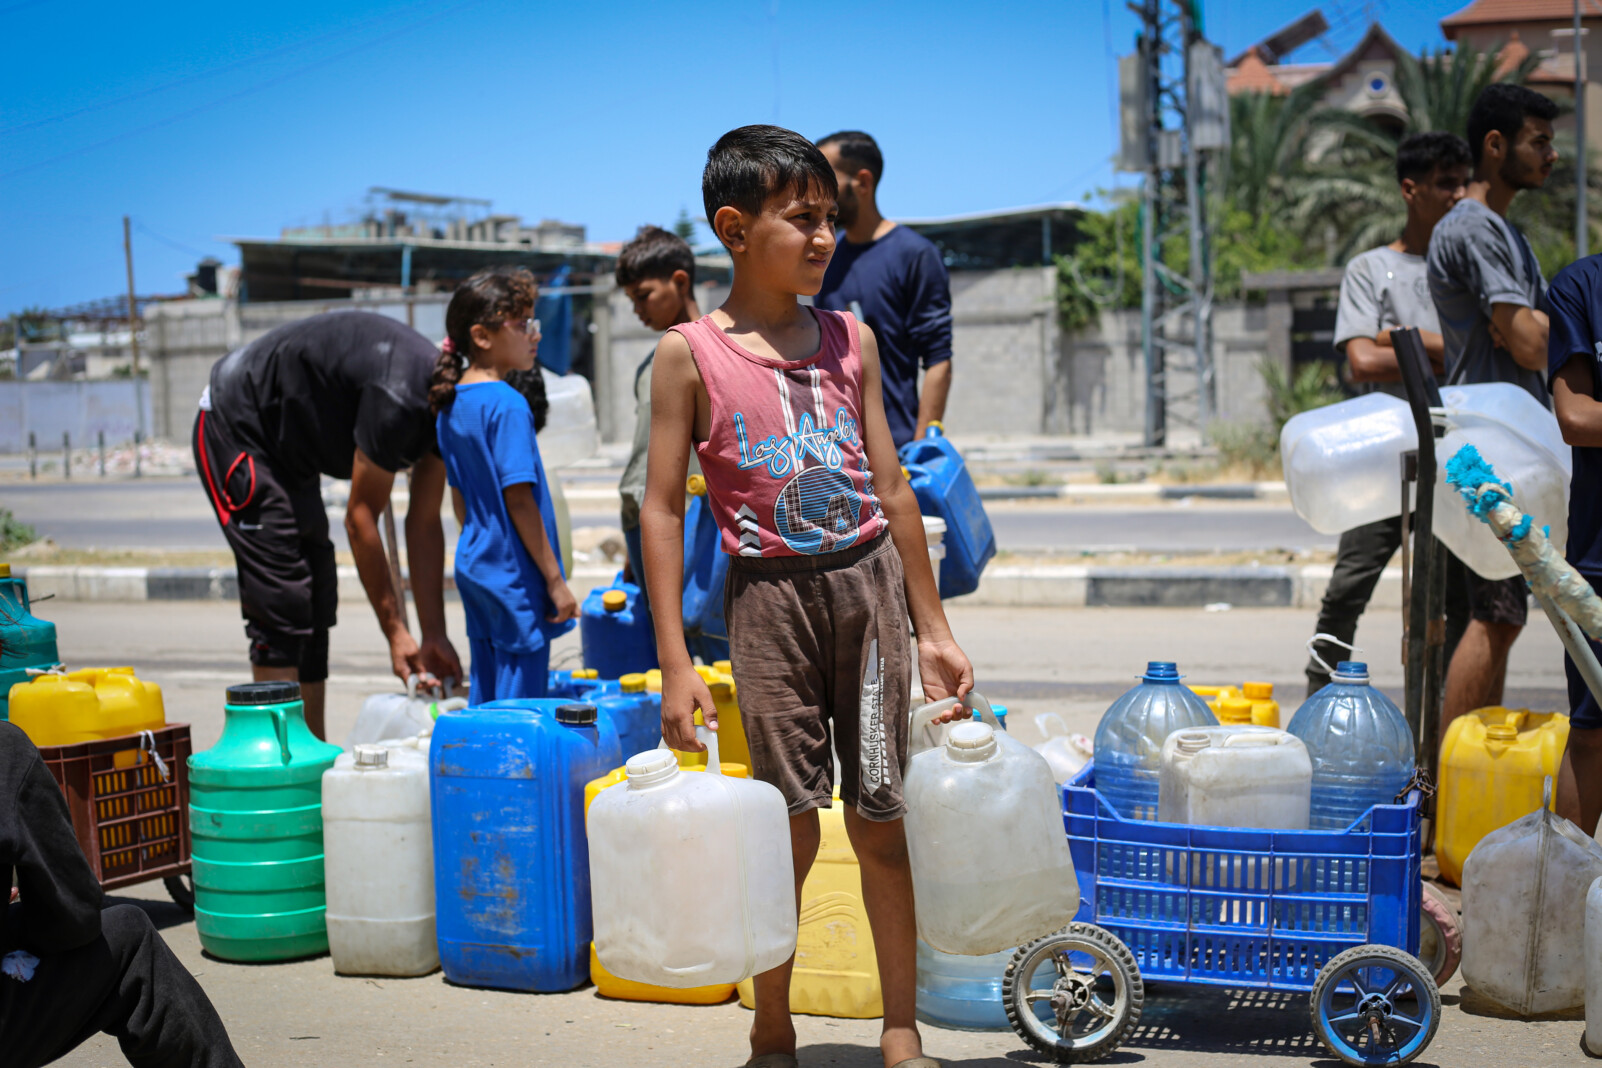
Universal access to safe drinking water is a fundamental need and human right.
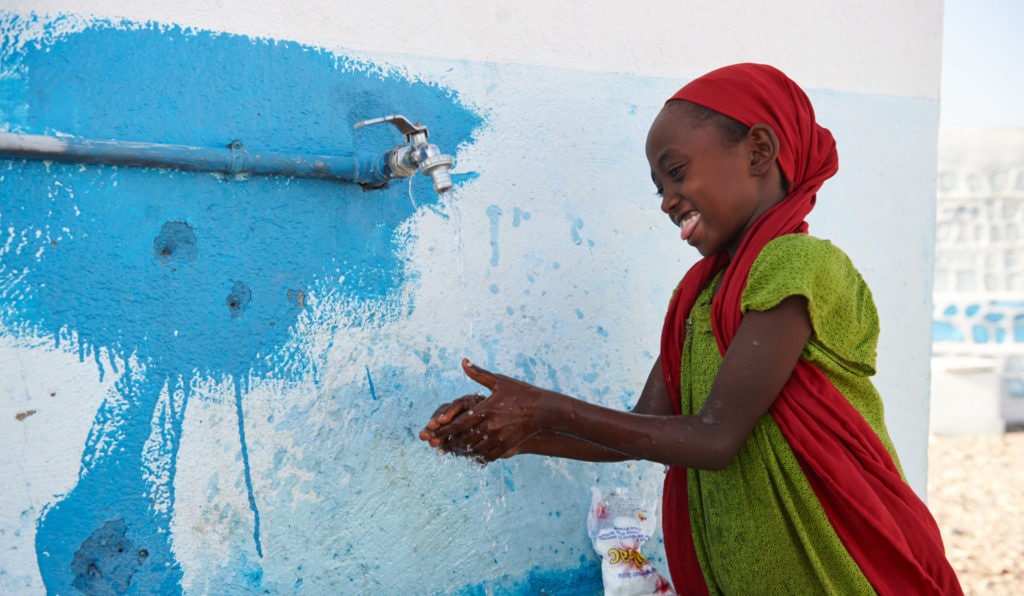
Securing access for all would go a long way in reducing illness and death, especially among children. “Safely managed” drinking water services represent an ambitious new rung on the ladder used to track progress on drinking water.
Between 2015 and 2024, 961 million people gained access to safely managed drinking water services, raising global coverage from 68% to 74%. However, 2.1 billion people still lacked safely managed drinking water, 1.5 billion had basic services, 287 million had limited services, 302 million relied on unimproved sources, and 106 million collected water directly from surface water sources such as rivers and lakes.
Behind these global figures, significant disparities in national progress remain. While many high-income countries had already achieved universal access (>99%), others lag far behind. In 2024, 89 countries had already achieved universal access to at least basic drinking water. Thirty-one countries had achieved universal access to safely managed drinking water, and if current trends continue 38 will have reached universal access by 2030.
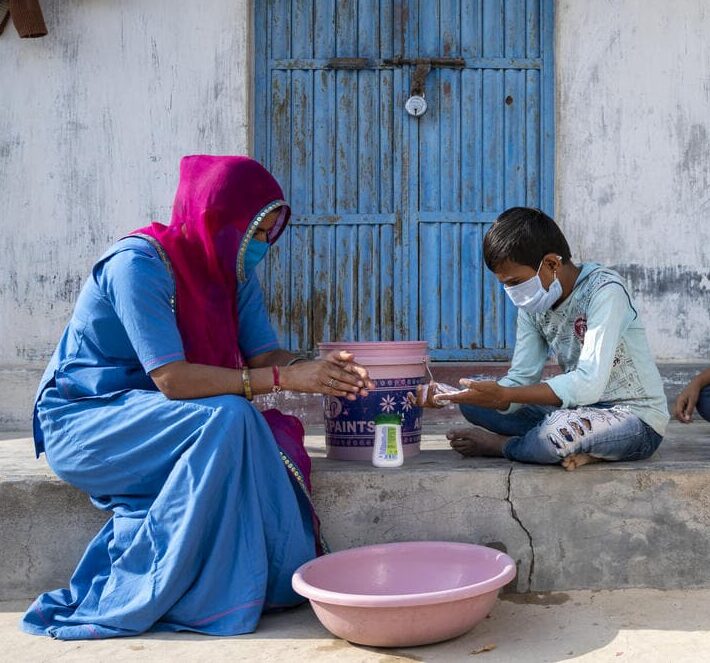
The data reveal stark inequalities: To achieve universal access to basic WASH services (SDG 1.4), lower-middle-income countries need to double current rates of progress and low-income countries would require a dramatic sevenfold increase in basic water. In fragile contexts, coverage of safely managed drinking water is 38 percentage points lower than in other countries.
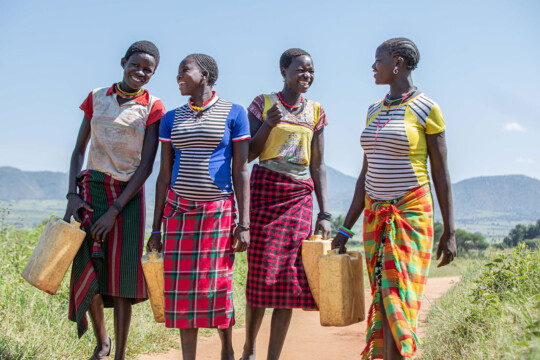
Individual-level data on time spent collecting water highlight inequalities between women and girls and men and boys. The burden of water collection continued to fall disproportionately on women and girls, especially in settings where water is not available on premises. Improving the accessibility of drinking water is a well-established priority given that women and girls are primarily responsible for domestic chores in many countries.
Subnational data show that WASH service levels often vary widely between rural and urban, subnational regions, richest and poorest, and ethnic groups. Emerging data on the dimensions of inequality show WASH service levels also vary between communities with and without access to roads, between minority ethnic and indigenous groups and the general population, and between individuals with and without functional disabilities.
The region of Australia and New Zealand has already achieved universal access (>99%) to basic drinking water services, and the Latin America and the Caribbean region is on track to achieve universal access by 2030, but the overall rate of progress will need to increase threefold to meet the global SDG target 1.4. No SDG region is on track to achieve universal access to safely managed services and the overall rate of progress will need to increase eightfold to meet the global SDG target 6.1.
Drinking water, sanitation and hygiene (WASH) estimates
Water, sanitation & hygiene (WASH) data
Build and download your own customisable dataset
Resources

Notes on the data
WHO/UNICEF Joint Monitoring Programme for Water Supply, Sanitation and Hygiene
Since 1990, WHO and UNICEF have tracked progress on global water and sanitation goals through the Joint Monitoring Programme for Water Supply, Sanitation and Hygiene (JMP). The JMP monitors trends in coverage; helps build national monitoring capacity in developing countries; develops and harmonises questionnaires, indicators and definitions to ensure comparability of data over time and among countries; and informs policymakers of the status of the water supply and sanitation sector through annual publications. The JMP draws guidance from a technical advisory group of leading experts in water supply, sanitation and hygiene, and from institutions involved in data collection and sector monitoring. Further information about the JMP and its methodology can be found at the JMP website.
Data sources
The JMP estimates for WASH in households are based on information collected through national data from a wide range of different data sources, censuses and surveys, as well as secondary sources in the absence of primary data. Data are harmonized to the extent possible based on internationally agreed indicator definitions. Further details on indicators, data sources and methods for WASH in households estimates can be found at the JMP website, including recommended core questions to support harmonized monitoring: Core questions and indicators for monitoring WASH in households in the SDGs.
Definitions of drinking water services in households
The JMP uses service ladders to benchmark and compare progress across countries and these have been updated and expanded for SDG monitoring. The drinking water ladder defines five levels of service, ranging from ‘surface water’ (no service) to ‘safely managed’ which is the global indicator for SDG target 6.1.
The SDG service ladder builds on the established improved/unimproved source type classification and introduces additional criteria related to the level of service provided. Improved sources include: piped water, boreholes, tubewells, protected dug wells, protected springs, rainwater and packaged or delivered water. Households using improved sources are divided into three categories. If a round trip to collect water, including queuing, exceeds 30 minutes, it counts as a ‘limited’ service, and if it takes no more than 30 minutes, it counts as a ‘basic’ service. To meet the SDG standard for a ‘safely managed’ service, improved sources must be accessible on premises, available when needed and free from contamination. The JMP also tracks the population using ‘unimproved’ sources (including unprotected dug wells and springs) and ‘surface water’ (drinking water directly from a river, dam, lake, pond, stream, canal or irrigation channel).
Since households with ‘safely managed’ services also meet the criteria for ‘basic’ services, these two categories can also be grouped together as ‘at least basic services’. This is one of the tracer indicators used for monitoring progress towards SDG target 1.4 on universal access to basic services.