Immunization resources
Resources and interactive dashboards based on the latest immunization data
July 2026

UNICEF and partners have created resources and interactive dashboards for easy access to immunization materials. This page provides an overview of available data products, including the latest WHO/UNICEF Estimates of National Immunization Coverage (WUENIC) and related immunization data.
General
Global datasets, trends and reference documents
Datasets
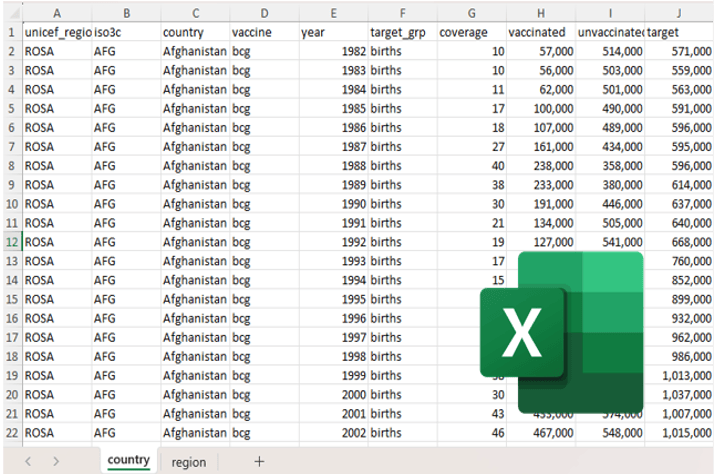
Download the latest country and regional WUENIC datasets and survey database.
Get the data
WUENIC trends
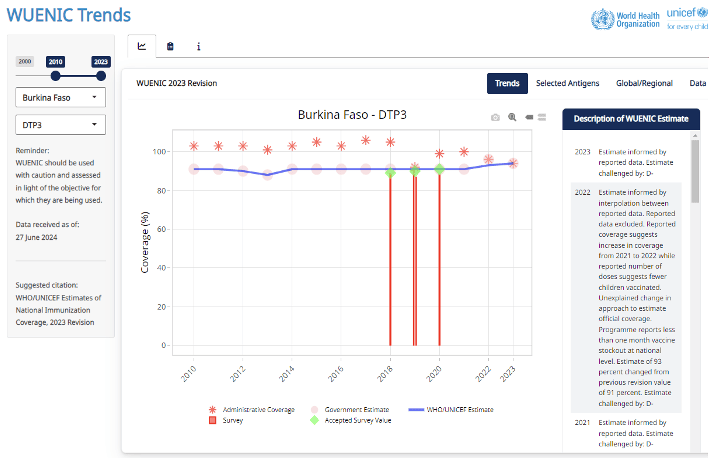
Interactive profiles summarising the latest WUENIC trends and country-reported data, including time series estimates, administrative and official coverage, survey data, and contextual information. Useful for exploring the data behind WUENIC estimates, country and regional trends, and vaccine comparisons over time.
Open the dashboard
WUENIC key accompanying documents
WUENIC notes for all countries provide background information on the estimates, including methodology, production cycle updates, data summaries, survey information and changes between revisions. The Progress and Challenges with Achieving Universal Immunization Coverage slides highlight key global-level stories.
View the documents
Country products
Country-level slides, profiles and talking points
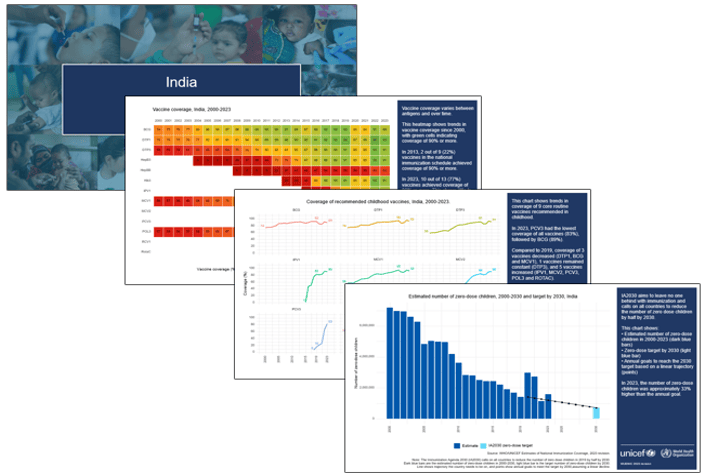
Immunization country slides
Slide decks presenting country-specific WUENIC data, including visualizations of vaccine coverage trends, IA2030 progress, regional rankings, vaccine drop-out rates, key messages, and interpretations. Useful for anyone interested in detailed country-level immunization data.
View the profiles
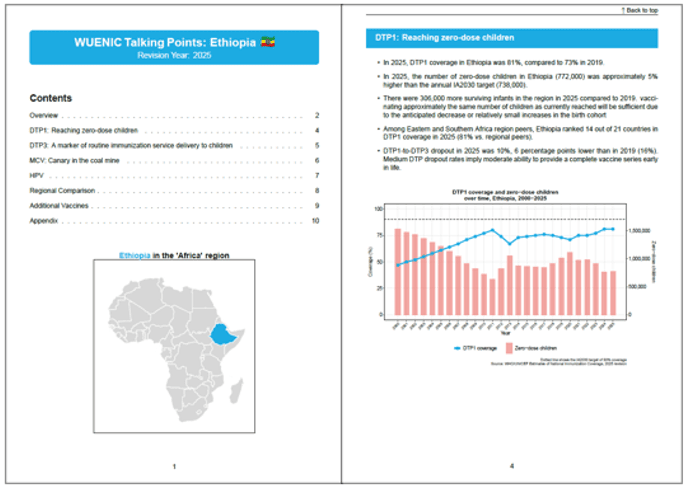
High-level country talking points
High-level summary of the latest WUENIC estimates, by country. Designed to support UNICEF country offices, partners, and advocacy teams in communicating key messages, engaging stakeholders, and guiding high-level discussions around immunization coverage trends and priorities.
View the profiles
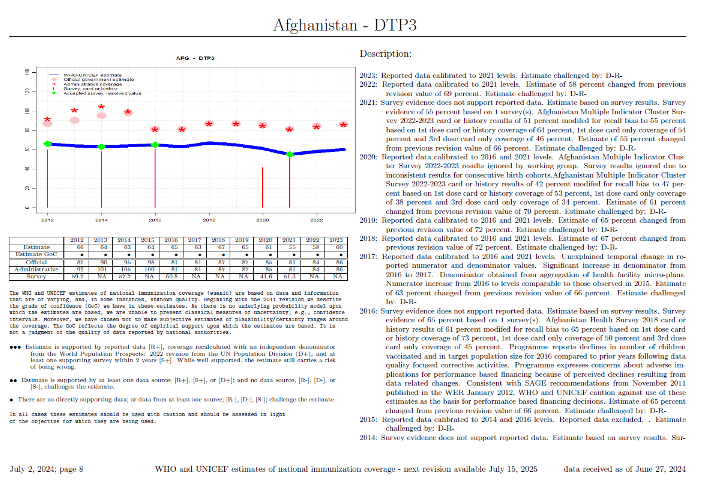
Immunization country profiles
Country-specific statistical profiles summarising the latest WUENIC and country-reported data, including time series estimates, administrative and official coverage, survey data, and contextual information such as vaccine stock-outs and health worker strikes. Useful for understanding the data behind WUENIC estimates and observed changes in coverage over time.
View the profiles
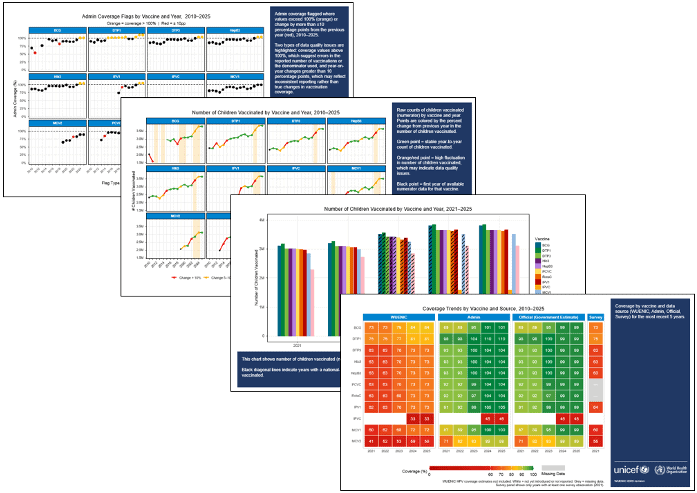
Country data quality reports
A systematic review of country-level data quality designed to support data review discussions. The reports assess key indicators of data quality — missing data, large year-to-year fluctuations, internal consistency, denominator inconsistencies, and coverage exceeding 100% — and highlight discrepancies between administrative coverage, WUENIC, survey results, and official government estimates.
View the profiles
Regional and country grouping products
Slide decks, snapshots and analytics for UNICEF, African Union, European Union, Gavi, World Bank and WHO groupings
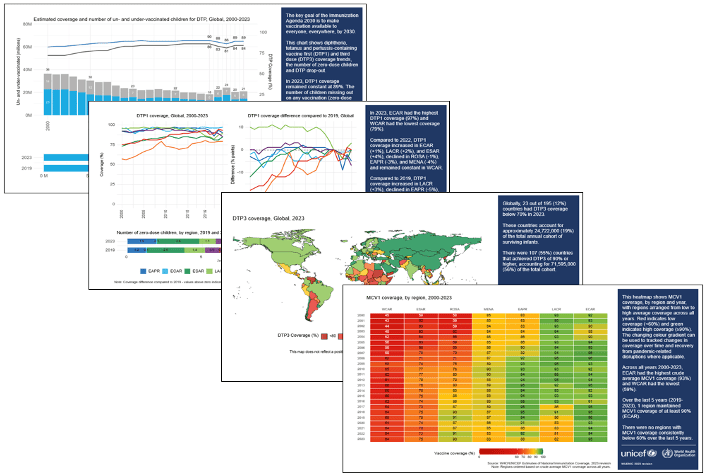
Immunization regional slides
Slide decks presenting global and region-specific WUENIC data and analyses, with visualizations of vaccine coverage trends, IA2030 progress, regional country rankings, vaccine drop-out rates, key messages, and interpretations. Available for UNICEF, WHO, African Union, World Bank, and Gavi regions.
View the slides
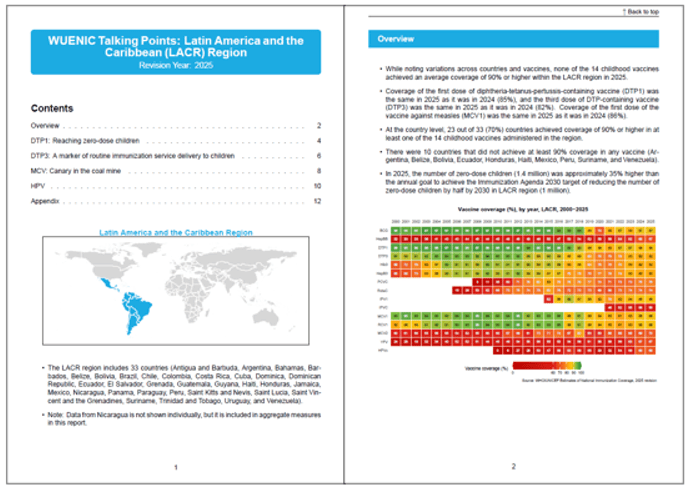
High-level regional talking points
High-level summary of the latest WUENIC estimates, by UNICEF and African Union region. Designed to support UNICEF regional offices, partners, and advocacy teams in communicating key messages, engaging stakeholders, and guiding high-level discussions around immunization coverage trends and priorities.
View the talking points
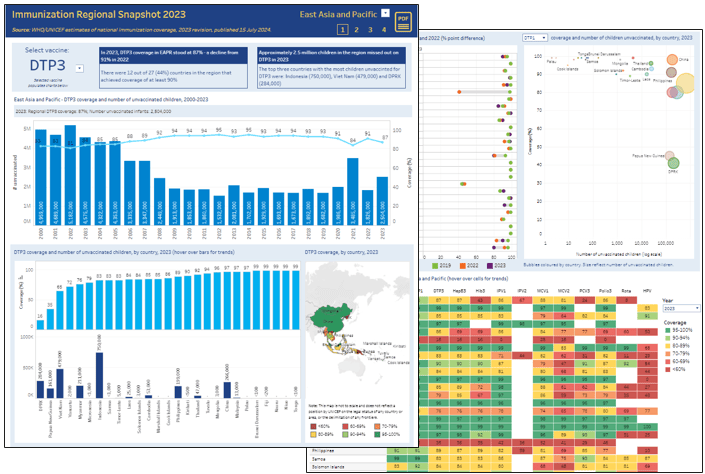
Immunization regional snapshots
Interactive, multi-page profiles displaying national and regional WUENIC data for various country groupings, including key messages, vaccine coverage trends, numbers of unvaccinated children, country and regional comparisons, maps, and measures of recovery since the COVID-19 pandemic. Profiles are downloadable.
Open the snapshots
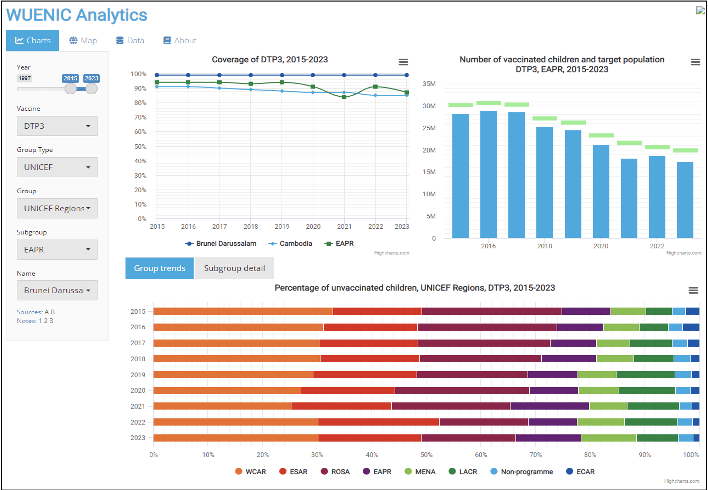
WUENIC Analytics dashboard
An interactive dashboard presenting WUENIC data for UNICEF, WHO, and World Bank regions, featuring visualizations of vaccine coverage and numbers of unvaccinated children. It allows for data exploration, country comparisons within regions, and data downloads.
Open the dashboard