Undernutrition contributes to nearly half of all deaths in children under 5 and is widespread in Asia and Africa
Nearly half of all deaths in children under 5 are attributable to undernutrition. This translates into the unnecessary loss of about 3 million young lives a year. Undernutrition puts children at greater risk of dying from common infections, increases the frequency and severity of such infections, and contributes to delayed recovery. In addition, the interaction between undernutrition and infection can create a potentially lethal cycle of worsening illness and deteriorating nutritional status. Poor nutrition in the first 1,000 days of a child’s life can also lead to stunted growth, which is irreversible and associated with impaired cognitive ability and reduced school and work performance.
Measures of child undernutrition are used to track development progress. In terms of overall progress towards the Millennium Development Goals, Sub-Saharan Africa is far behind all other regions and the furthest from reaching a 50 per cent reduction in stunting prevalence since 1990. Meanwhile, the number of overweight children worldwide – another aspect of malnutrition – is rapidly rising.
Now, in the Post-2015 development era, estimates of child malnutrition will help determine whether the world is on track to achieve the Sustainable Development Goals – particularly, Goal 2 to “end hunger, achieve food security and improved nutrition, and promote sustainable agriculture”.
Stunting
In 2015, 23.2 per cent, or just under one in four children under age 5 worldwide had stunted growth. That said, overall trends are positive. Between 1990 and 2015, stunting prevalence globally declined from 39.6 per cent to 23.2 per cent, and the number of children affected fell from 255 million to 156 million. In 2015, just two out of every four stunted children lived in South Asia and one in three in sub-Saharan Africa.
Globally, stunting declined from two in five to just under one in four between 1990 and 2015
* Central Eastern Europe/Commonwealth of Independent States. Due to consecutive lack of any data, results are not displayed for year 1990; the CEE/CIS region does not include Russia due to missing data; Consecutive low population coverage for the 2015 estimate (interpret with caution).
Source: UNICEF/WHO/World Bank Joint Child Malnutrition Estimates, September 2016 edition.
Explore data on malnutrition in an interactive visualization
Between 1990 and 2015, the number of stunted children under 5 worldwide declined from 255 million to 156 million. At the same time, numbers have increased at an alarming rate in West and Central Africa – from 19.9 million to 28.3 million.
Between 1990 and 2015, the number of stunted children under 5 worldwide declined from 255 million to 156 million. At the same time, numbers have increased at an alarming rate in West and Central Africa - from 19.9 million to 28.3 million
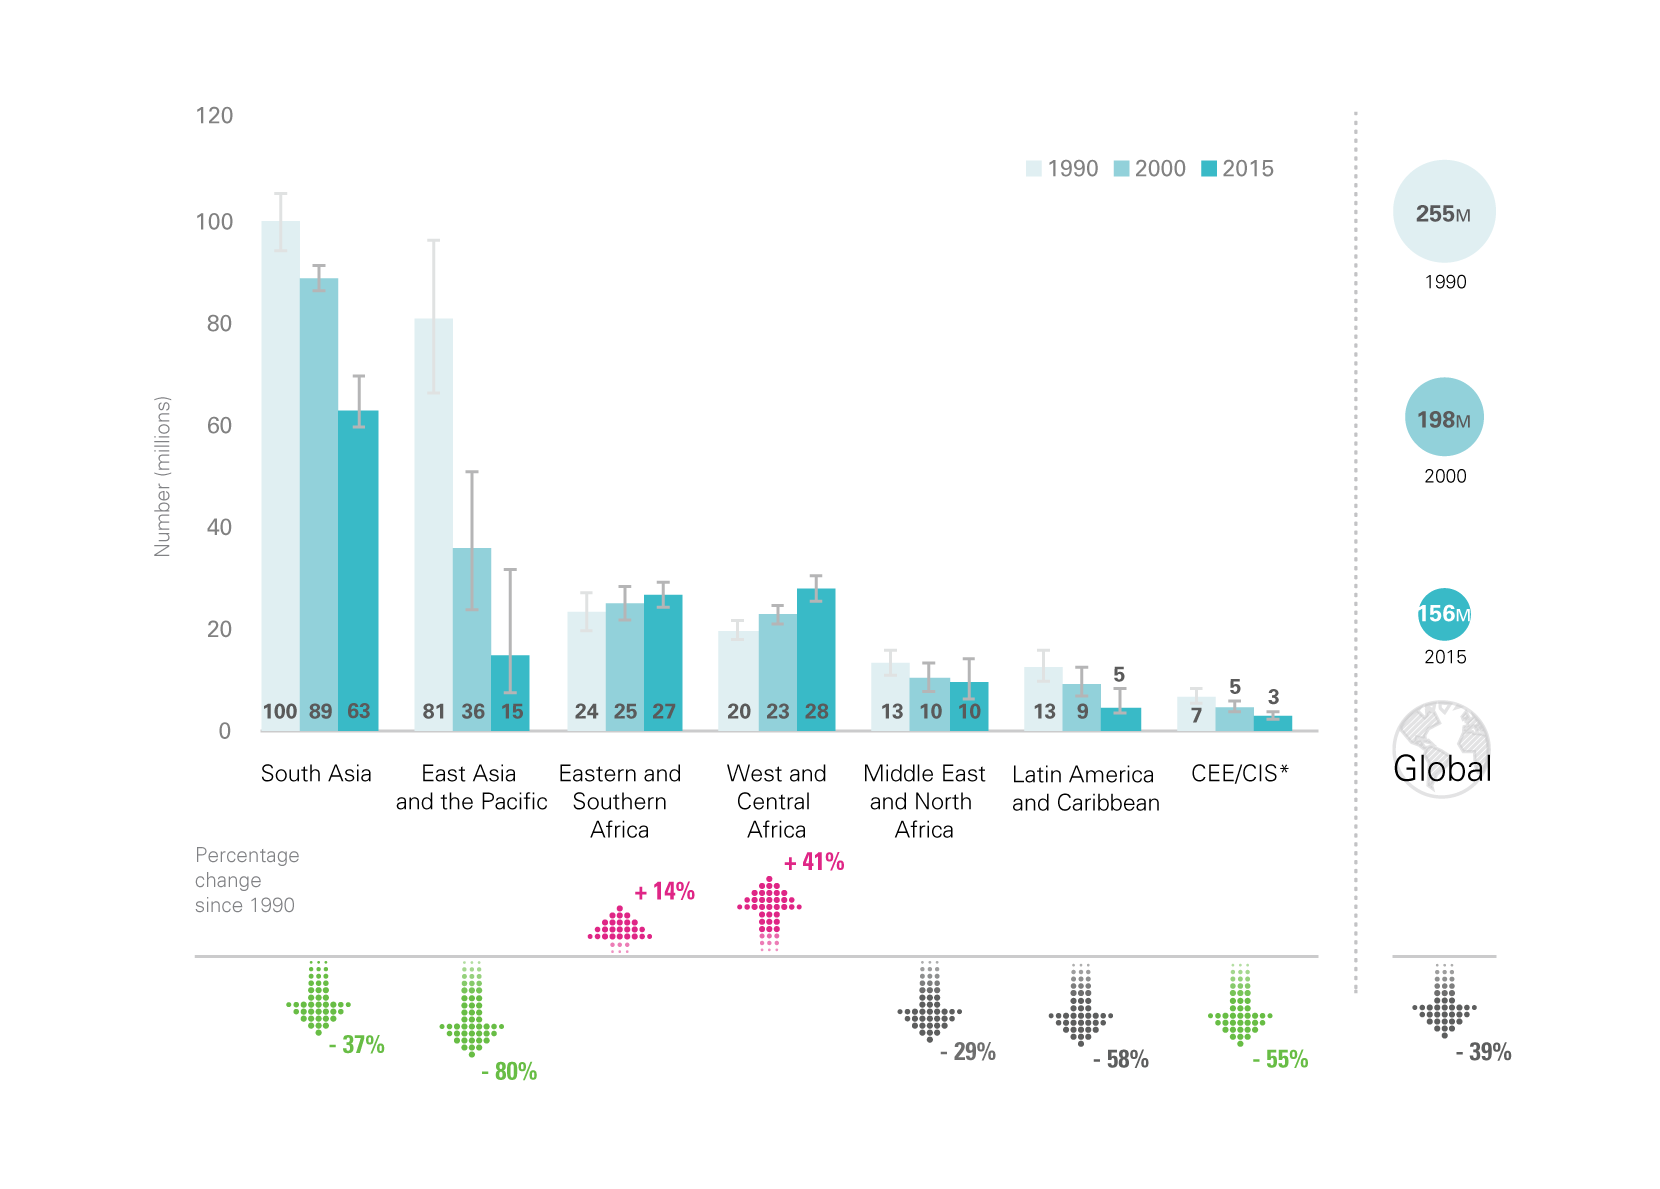
Notes: * Central Eastern Europe/Commonwealth of Independent States. Due to consecutive lack of any data, results are not displayed for year 1990 (1995 is presented instead); the CEE/CIS region does not include Russia due to missing data; Consecutive low population coverage for the 2015 estimate (interpret with caution).
Source: UNICEF/WHO/World Bank Joint Child Malnutrition Estimates, September 2016 edition.
Explore data on malnutrition in an interactive visualization
Overweight
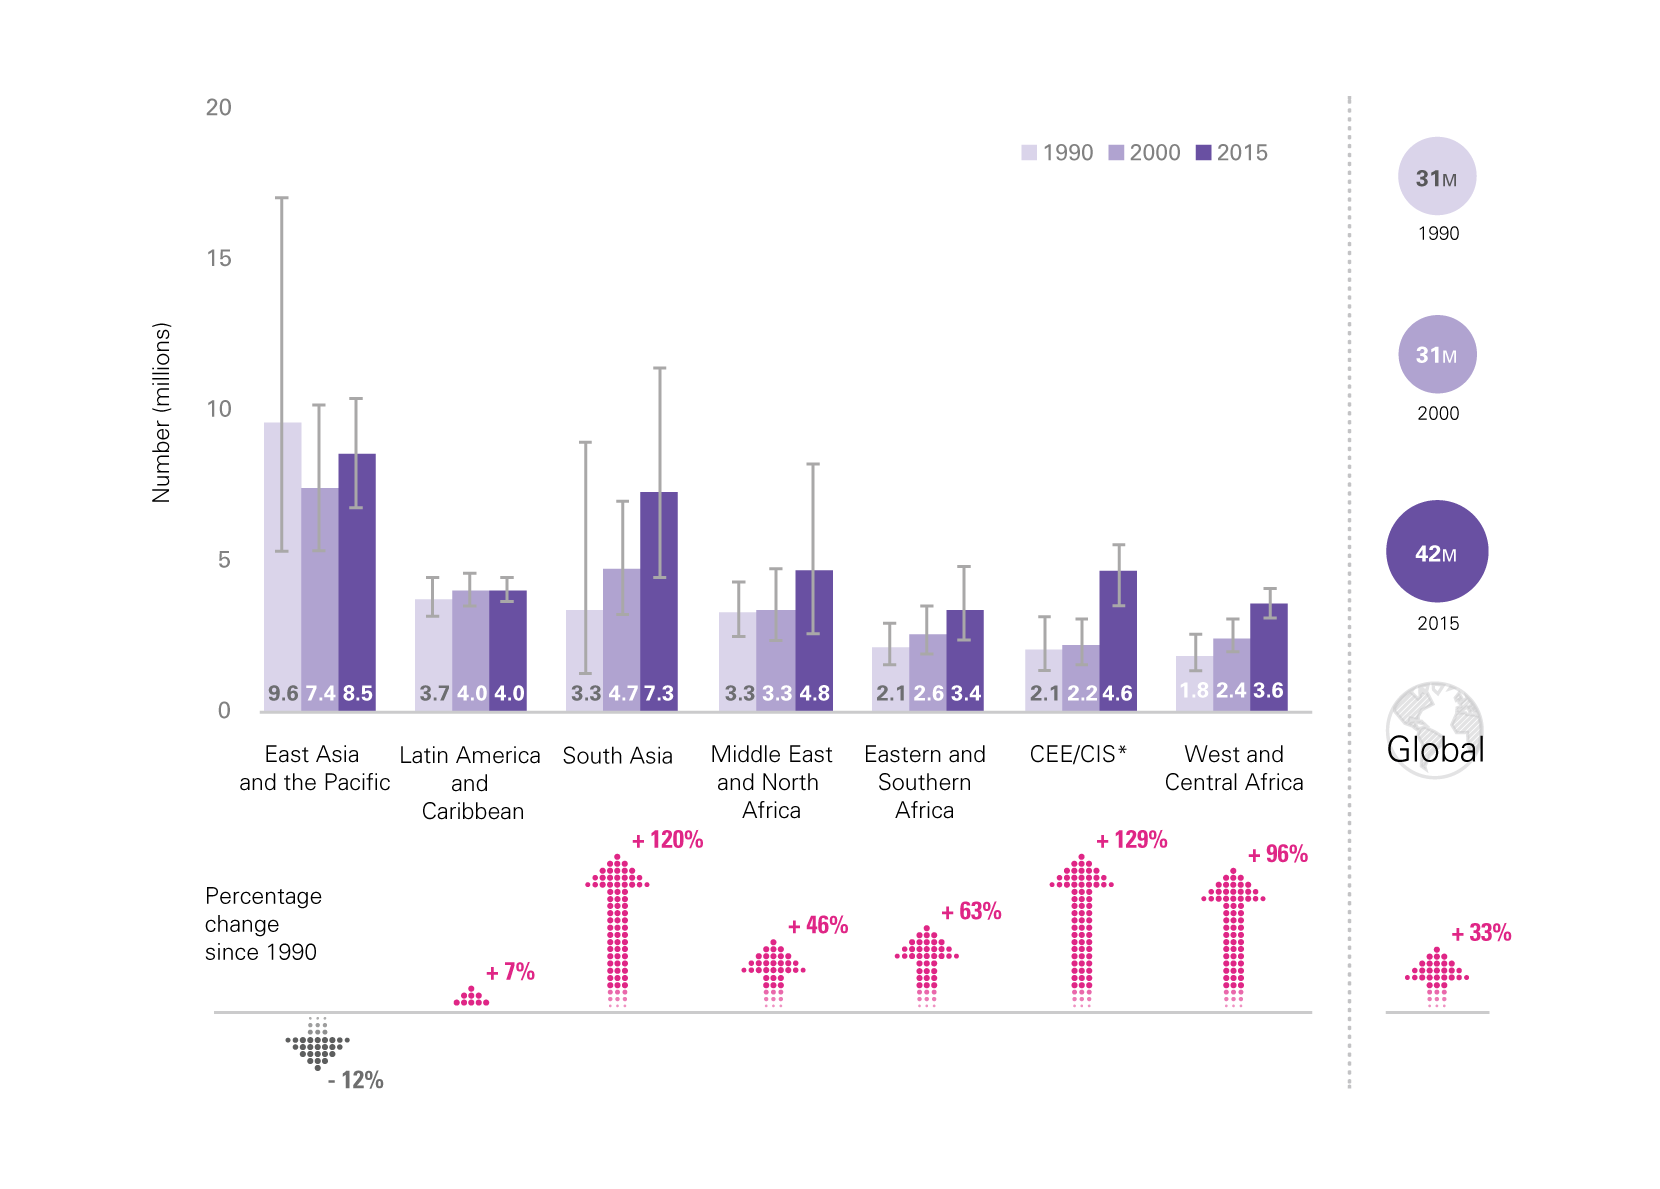
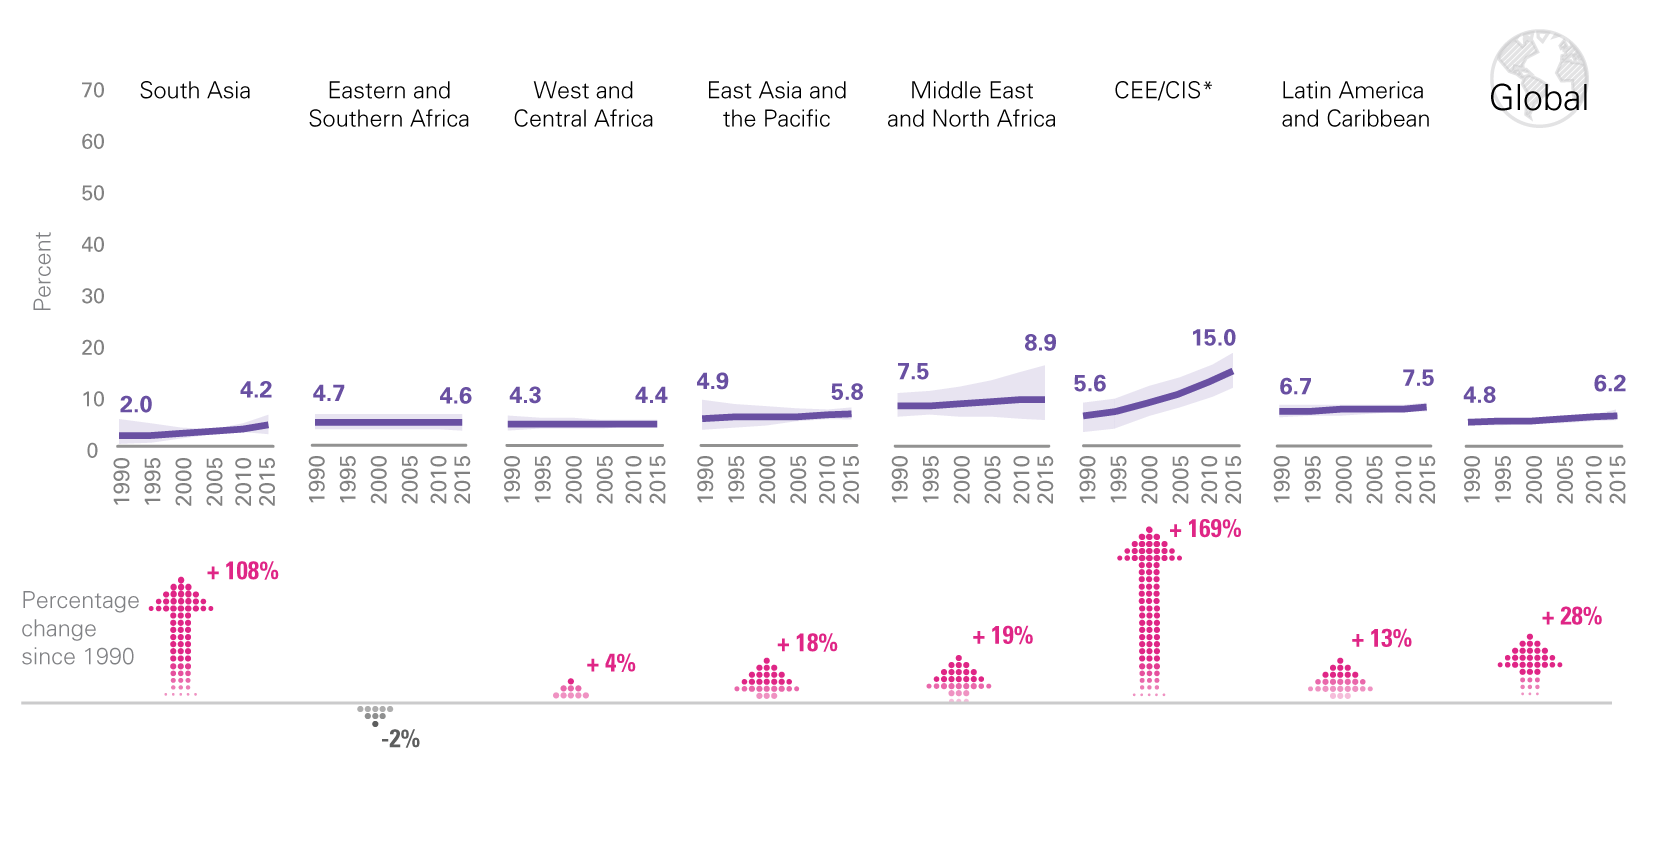
Worldwide, in 2015, 42 million children under age 5 were overweight, up from 31 million in 2000. Trends suggest that this number will continue to rise. Between 2000 and 2013, overweight prevalence increased from 1 per cent to 19 per cent of the under-five population in Southern Africa. The rise in overweight prevalence is reflected in all regions, with the greatest absolute and relative increases in CEE/CIS. While the numbers of children affected have been steady in Latin America and the Caribbean and decreasing in East Asia and the Pacific, they have been increasing in all other regions. Despite the decline in East Asia and the Pacific, the region had the highest number of overweight children in 2015. Of particular concern is the rise in the number of both stunted and overweight children in West and Central Africa, whose health-care systems are ill-equipped to manage this double – and growing – burden of malnutrition.
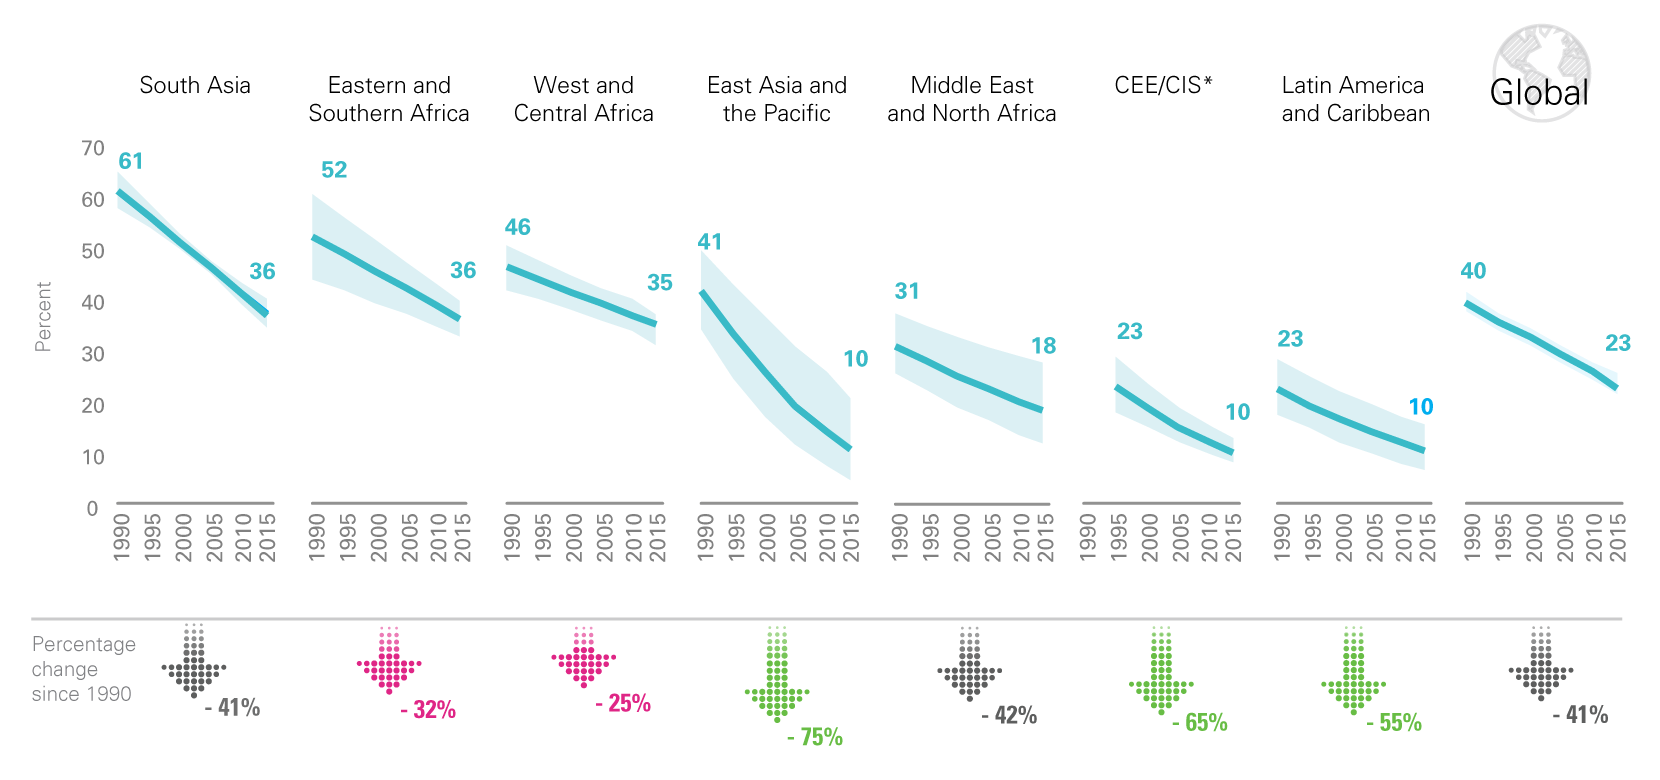
Globally, underweight prevalence continues to decline, but progress in West and Central Africa has been slow
* Central Eastern Europe/Commonwealth of Independent States. Due to consecutive lack of any data, results are not displayed for year 1990; the CEE/CIS region does not include Russia due to missing data; Consecutive low population coverage for the 2014 estimate (interpret with caution).
Source: UNICEF/WHO/World Bank Joint Child Malnutrition Estimates, September 2015 edition.
Explore data on malnutrition in an interactive visualization
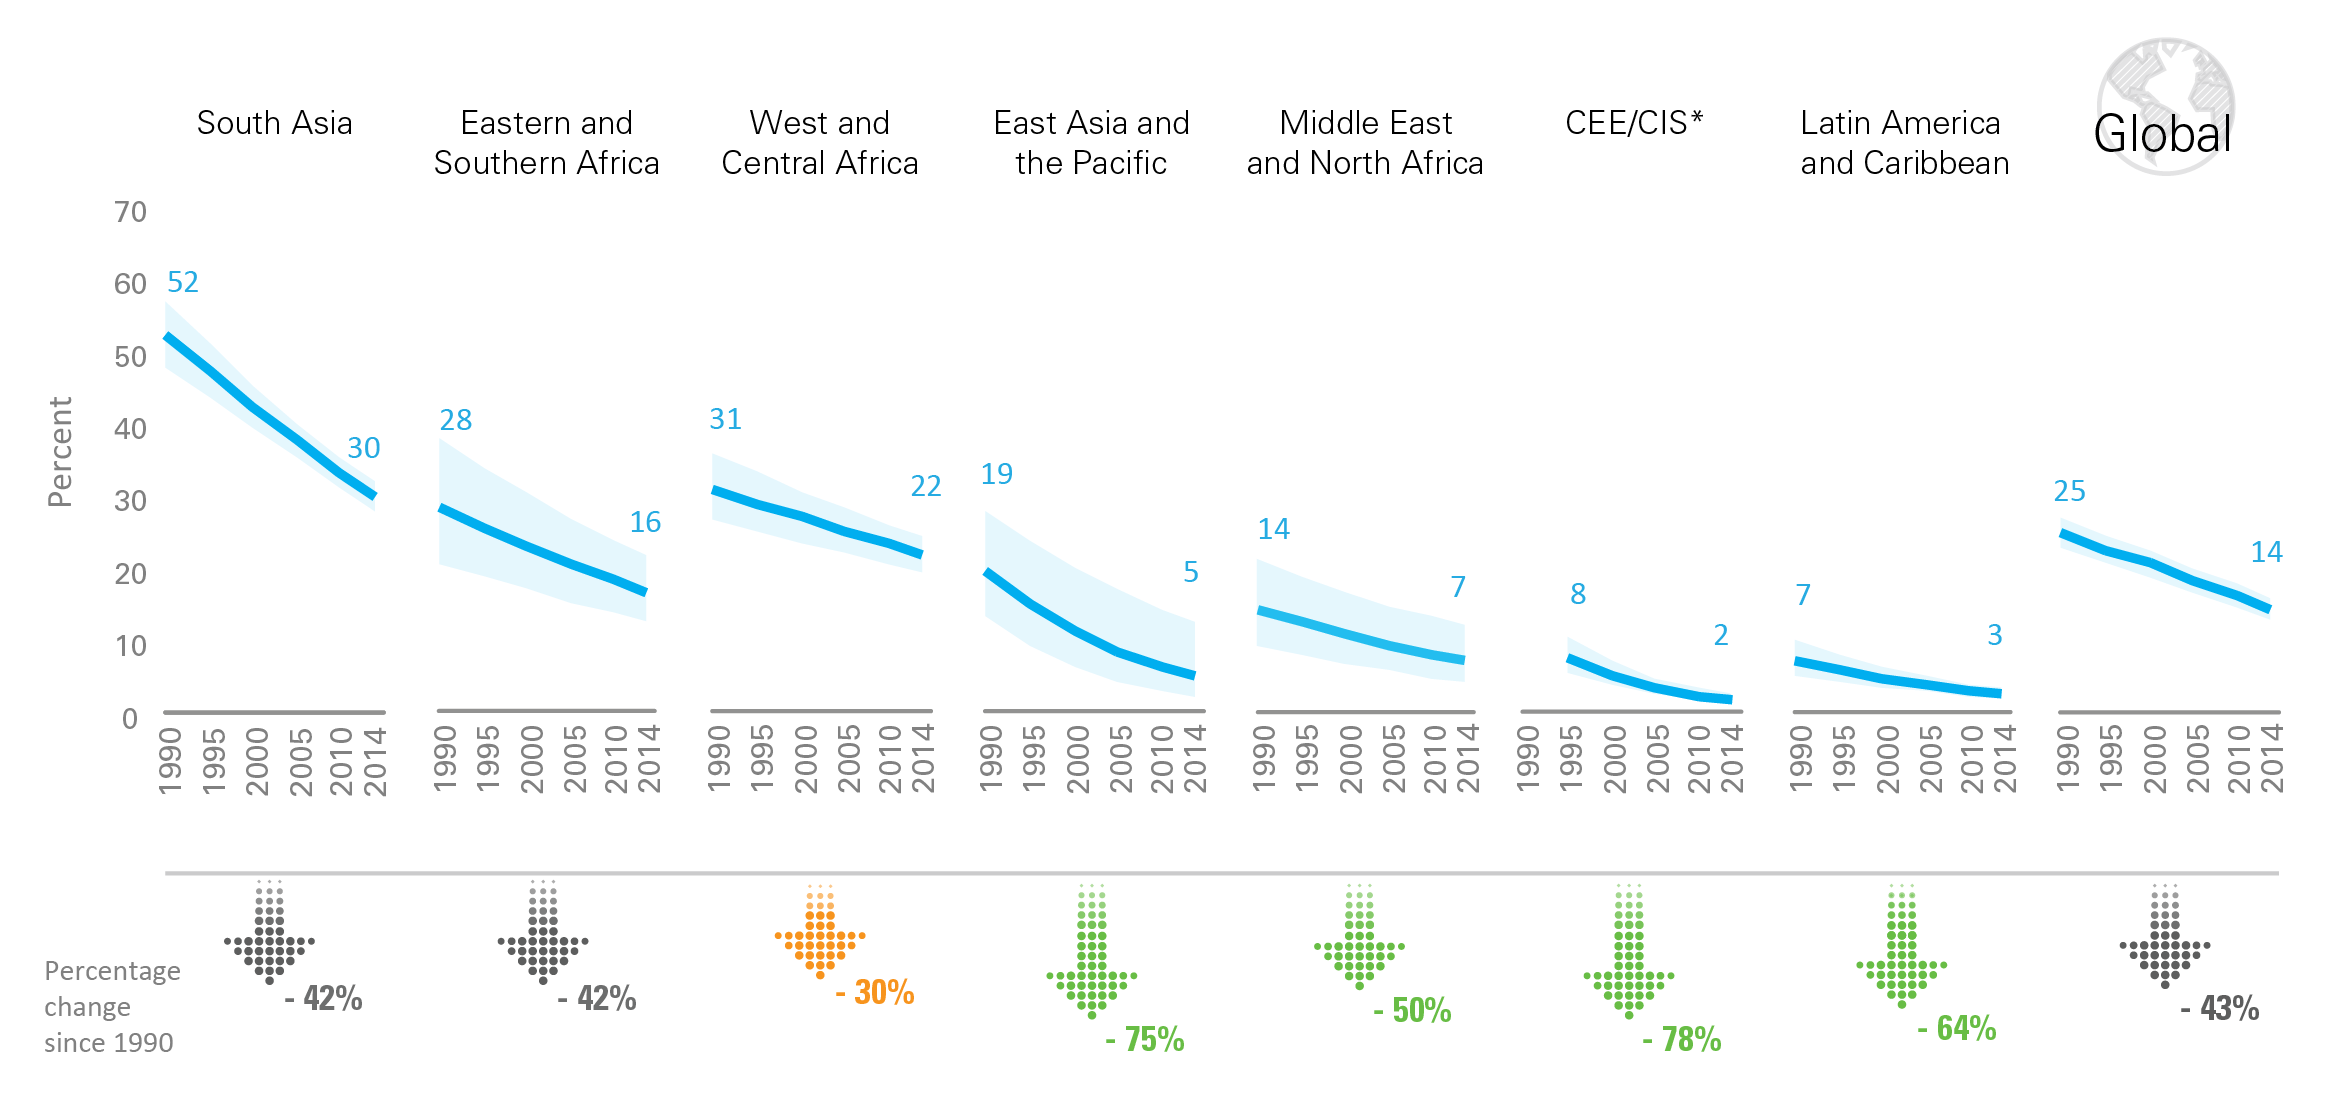
In most regions, the number of overweight children continues to rise
Notes: * Central Eastern Europe/Commonwealth of Independent States. Due to consecutive lack of any data, results are not displayed for year 1990 (1995 is presented instead); the CEE/CIS region does not include Russia due to missing data; Consecutive low population coverage for the 2015 estimate (interpret with caution).
Source: UNICEF/WHO/World Bank Joint Child Malnutrition Estimates, September 2016 edition.
Explore data on malnutrition in an interactive visualization
Wasting and Severe Wasting
In 2015 globally, 50 million children under 5 were wasted and 17 million were severely wasted. This translates into a prevalence just over 7 per cent and just less than 3 per cent, respectively. In 2015, half of all wasted children lived in South Asia and one quarter in sub-Saharan Africa, with similar proportions for severely wasted children. At 14.7 per cent, South Asia’s wasting prevalence is close to becoming a ‘critical’ public health problem; that of West and Central Africa is approaching a ‘serious’ need for intervention with appropriate treatment programmes. Under 5 wasting and severe wasting are highly sensitive to change. Thus, estimates for these indicators are only reported for current levels (2015).
In most regions, the proportion of overweight children continues to rise
* * Central Eastern Europe/Commonwealth of Independent States. Due to consecutive lack of any data, results are not displayed for year 1990; the CEE/CIS region does not include Russia due to missing data; Consecutive low population coverage for the 2015 estimate (interpret with caution).
Source: UNICEF/WHO/World Bank Joint Child Malnutrition Estimates, September 2016 edition.
Explore data on malnutrition in an interactive visualization
Disparities
In almost all countries with available data, stunting rates are higher among boys than girls. While analyses to determine underlying causes for this phenomenon are underway, initial review of the literature suggests that the higher risk for preterm birth among boys (which is inextricably linked with lower birth weight) is a potential reason for this sex-based disparity in stunting.
[Malnutrition-6b-173]
Children from the poorest 20 per cent of the population are more than twice as likely to be stunted as those from the richest quintile. In South Asia, the disparities between the richest and poorest children in regard to stunting are greater than in any other region. Generally, children residing in rural areas are more likely to be stunted than their urban counterparts.
[Malnutrition-7-168]
Progress in reducing underweight prevalence also shows inequities between the rich and the poor. In India, for example, no significant improvement has been noted in underweight prevalence among children from the poorest quintile over the period from around 1993 to around 2006. Meanwhile, children in the richest quintile showed a drop of about one third.
[Malnutrition-8-169]
Notes on the Data
INDICATORS
| Indicator name | Definition | |
|---|---|---|
| Numerator | Denominator | |
| Stunting | Number of under-fives falling below minus 2 standard deviations (moderate and severe) and minus 3 standard deviations (severe) from the median height-for-age of the reference population | Children under 5 years of age in the surveyed population |
| Underweight | Number of under-fives falling below minus 2 standard deviations (moderate and severe) and minus 3 standard deviations (severe) from the median weight-for-age of the reference population | Children under 5 years of age in the surveyed population |
| Wasting | Number of under-fives falling below minus 2 standard deviations (moderate and severe) and minus 3 standard deviations (severe) from the median weight-for-height of the reference population | Children under 5 years of age in the surveyed population |
| Overweight | Number of under-fives above 2 standard deviations from the median weight-for-height of the reference population | Children under 5 years of age in the surveyed population |
REFERENCE POPULATION
Prevalence of underweight, stunting and wasting among children under 5 is estimated by comparing actual measurements to an international standard reference population. In April 2006, the World Health Organization released the WHO Child Growth Standards to replace the widely used National Center for Health Statistics (NCHS)/WHO reference population, which was based on a limited sample of children from the United States of America. The new standards are the result of an intensive study project involving more than 8,000 children from Brazil, Ghana, India, Norway, Oman and the United States. Overcoming the technical and biological drawbacks of the old reference population, the new standards confirm that children born anywhere in the world and given the optimum start in life have the potential to reach the same range of height and weight. It follows that differences in children’s growth to age 5 are more influenced by nutrition, feeding practices, environment and health care than by genetics or ethnicity.
The new standards should be used in future assessments of child nutritional status. It should be noted that because of the differences between the old reference population and the new standards, prevalence estimates of child anthropometry indicators based on these two references are not readily comparable. It is essential that all estimates are based on the same reference population (preferably the new standards) when conducting trend analyses.
ADJUSTING COUNTRY-LEVEL ESTIMATES
Before conducting trend analyses of child nutritional status, it is important to ensure that estimates from various data sources are comparable over time. For example, household surveys in some countries in the early 1990s only collected child anthropometry information among children up to 47 months of age – or even up to only 35 months of age. Prevalence estimates based on such data only referred to children under 4 or under 3 years of age and are not comparable to prevalence estimates based on data collected from children up to 59 months of age. Some age adjustment needs to be applied to make these estimates based on non-standard age groups comparable to those based on the standard age range. For more information about age adjustment, please click here to read a technical note. In addition, prevalence estimates need to be calculated according to the same reference population. Those calculated according to the WHO Child Growth Standards are not comparable to those calculated according to the NCHS/WHO reference population. For more information about the difference between the two references and its implications, please click here to read a technical note.
ESTIMATING COUNTRY-LEVEL PROGRESS
Country-level progress in reducing undernutrition prevalence is evaluated by calculating the average annual rate of reduction (AARR) and comparing this to the AARR needed in order to be able to reduce prevalence by half over 25 years. For more information about how to calculate country-level AARR, please click here to read a technical note.
ESTIMATING REGIONAL TRENDS BY MULTILEVEL MODELLING
Estimation of regional and global trends has been based on a multilevel modelling method (see de Onis et al. in JAMA, 2004). For the most recent trend analysis presented below, a total of 606 data points from 141 countries over the period 1985 to 2010 were included in the model. This set of trend data points was jointly reviewed by UNICEF and WHO in June and July 2011 to ensure that it is nationally representative of under-five children, processed using standard algorithms and comparable vertically and horizontally. Regional trend modelling and graphing were carried out using STATA 11 on two ‘do’ files (the data set and do files are available on request).
Model-based trend analysis of underweight prevalence (percentage), by region

Note: * CEE/CIS: Central and Eastern Europe and the Commonwealth of Independent States.
How to read this chart:
Each circle (bubble) represents a prevalence estimate from a country in a data year. The size of the circle is proportional to the under-five population in that country in the data year. For each region, a solid line indicates the regional trend as modelled by the multilevel logit regression on all the available data points in the region. The dashed lines in each region indicate the lower and upper bounds of the regional trend line corresponding to the confidence interval of the estimated trend.
Click here for a higher-resolution version of the above chart.