SDMX API Queries - Structure and Data Access

Use the SDMX REST API to programmatically access data that is available in UNICEF’s Data Warehouse Explorer.
With the SDMX API, users can request various dimensions as a parameter in the URL such as series code, country code, frequency and time range, etc., and the resulting data can be downloaded as CSV or JSON.
Contents
- Scope
- The SDMX Standard
- Data Model Overview
- Data Discovery & Selection
- Understanding the JSON Data Format
- Tableau & Excel Connectors
- API Call Cheat Sheet
Scope
This document contains information on how to query an SDMX REST endpoint. It is intended to be as simple as possible to allow data consumers to quickly access the data without knowing the standard in detail.
The SDMX standard
The Statistical Data and Metadata eXchange is an ISO standard designed to describe statistical data and metadata. It is the preferred standard for statistical data exchange in the UN and in many other statistical organizations.
The standard defines, amongst other things, a common data model and standardized data access interfaces (APIs).
For more information about the SDMX standard, please visit the links below:
Data model overview
Data from SDMX is organized in Dataflows. Each dataflow contains a set of data with a common structure (e.g. data values about the population by country) and is structured using a Data Structure Definition (DSD) that can be re-used across dataflows. The dataflow can be seen as a container for data having a common structure (and usually groups similar topics owing to it being based on a hypercube model).
The structure of a dataflow/DSD is defined using a set of dimensions, e.g. for a population dataflow a simplified set of dimensions could be: country, indicator (total population, migrants…) and year.
The allowed values for each dimension are contained in a controlled list of codes; the Codelist. For example, the Codelist connected to the country dimension contains the list of allowed countries. This allows for easy reuse of codelists across structures.
Each datapoint is uniquely identified by the combination of values in each dimension, e.g: Country = France, Indicator = Total population, Year = 2010.
A datapoint can have attributes attached to it such as the measurement unit, some notes, the data source, etc.
The standard supports several formats for data access, the most used are:
- JSON (data and structures)
- XML (data and structures)
- CSV (data)
Data discovery and selection
The data discovery process can be summarized in the following steps:
- Obtain the list of dataflows and select one.
- Obtain the structure of the DSD attached to the dataflow (Dimensions, Codelists, Attributes).
- Select the desired slice of data.
The SDMX registry gives access to data and structure through APIs. UNICEF’s SDMX registry also provides a graphical user interface that can be used to explore and test during development.
UNICEF’s SDMX registry can be reached at:
Connecting to the SDMX endpoint
The UNICEF’s REST API endpoint is:
https://sdmx.data.unicef.org/webservice/data.html
API calls can be generated and tested using the SDMX registry’s user interface:
Downloading the list of dataflows
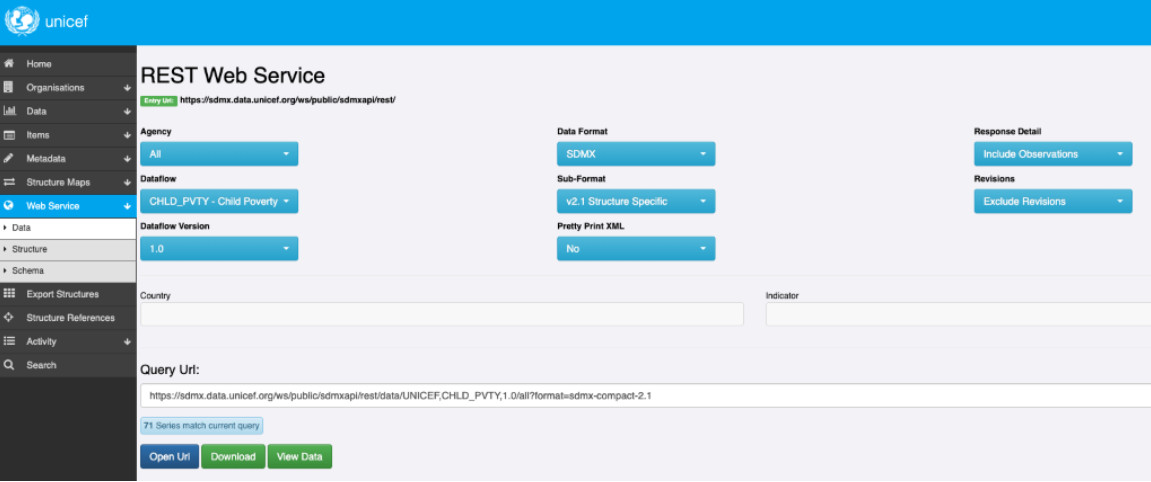
The “REST Web Service” GUI can be used to generate the API calls:
- Select Web Service in the left menu.
- Select Structure from the submenu (we’re accessing structures at this point, not data just yet).
- Select Dataflow as Structure Type.
- The Query URL text field is updated with URL to call to obtain the resource.
- Click on the Open URL button to test the call in the browser and see the structure returned
- To obtain the JSON version simply edit the call changing the format=sdmx-2.1 parameter to format=sdmx-json: https://sdmx.data.unicef.org/ws/public/sdmxapi/rest/dataflow/all/all/latest/?format=sdmx-json&detail=full&references=none
The call returns the list of available dataflows, with each dataflow being identified by
- Agency Id
- Id
- Version
Example:
{"name":"Child Poverty",

"names":{"en":"Child Poverty"},

"id":"CHLD_PVTY",

"version":"1.0",

"agencyID":"UNICEF",

"isExternalReference":false,

"isFinal":true,

"structure":"urn:sdmx:org.sdmx.infomodel.datastructure.DataStructure=UNICEF:DSD_CHLD_POV(1.0)"}
Downloading the structure
After selecting one of the available dataflows it is possible to download and explore the Data Structure.
The generic API call to download the structure is:
https://sdmx.data.unicef.org/ws/public/sdmxapi/rest/dataflow/all/{DataflowId}/latest/?format=sdmx-json&detail=full&references=all
The same call without the detail=structureOnly parameter will return structure and data.
Again, it is possible to use the GUI to generate and test the REST call:
- Select Web Service in the left menu.
- Select Data from the submenu.
- Select Dataflow as Structure Type.
- Select a Dataflow.
- The query is updated and can be tested in the browser.
Downloading a slice of data
The whole dataset can be downloaded using the previous call via omitting the structureOnly parameter, or can be downloaded partially.
- The API call for the full data download is:
https://sdmx.data.unicef.org/ws/public/sdmxapi/rest/data/{AgencyId},{DataflowId},{Version}/all?format=sdmx-json
- The API call for a partial data download is:
https://sdmx.data.unicef.org/ws/public/sdmxapi/rest/data/{AgencyId},{DataflowId},{Version}/{DataQuery}?format=sdmx-json
The DataQuery parameter must identify the codes selected for each dimension, multiple codes can be selected for the dimension by using the “+” separator, each dimension is separated by a dot.
An example call is:
In this case the dataflow has three dimensions:
- Reference Area (the countries ALB and DZA)
- Indicator (MNCH_INSTDEL)
- Sex (Male, Female, Total – all dimensions are selected so no need to specify in query).
Again:
- The query asks for Albania and Algeria (ALB+DZA) for the first dimension
- The MNCH_INSTDEL indicator for the second dimension
- And all the sex values for the sex dimension (when no value is given it is interpreted as “all”).
Summary: the “dot” separates the dimensions, the “+” separates the values for the dimension.
Data can be downloaded in CSV format using the format=csv parameter. As of this registry version, the csv download is limited to labels only (not codes), and can be used for data visualization tasks but not for data exchange purposes (labels are not as reliable as codes, there is no guarantee of uniqueness).
Understanding the JSON data format
The data retrieved from the SDMX endpoint in JSON is very compact to be efficiently transferred over the internet, and for this reason it requires a small amount of work to connect the values with the dimensions and attributes.
The response contains two main parts:
- Structure
- dataSets
The Structure
The structure part contains all the structural information for the dataflow: the name and description, the Dimensions, the Codelists and the Attributes.
- The dimensions are in the structure > dimensions > observation Each dimension contains the codelist used (in the values node)
- The attributes are in the structure > attributes > observation Attributes can also be attached to a dataset or an entire data series, in that case the attribute can be found in the dataset or series node.
The Data
The dataSets node contains the data points.
Each datapoint is identified by a key: e.g. 0:0:0:1
The key is connected to the dimension by the position, e.g. DimensionAtPosition0: DimensionAtPosition1: DimensionAtPosition2: DimensionAtPosition3
The number identifies the item in the Codelist; in the example (0:0:0:1):
- Dimension1: item 0
- Dimension2: item 0
- Dimension3: item 0
- Dimension4: item 1
The following image is a visual representation of how the values are connected to the dimensions:
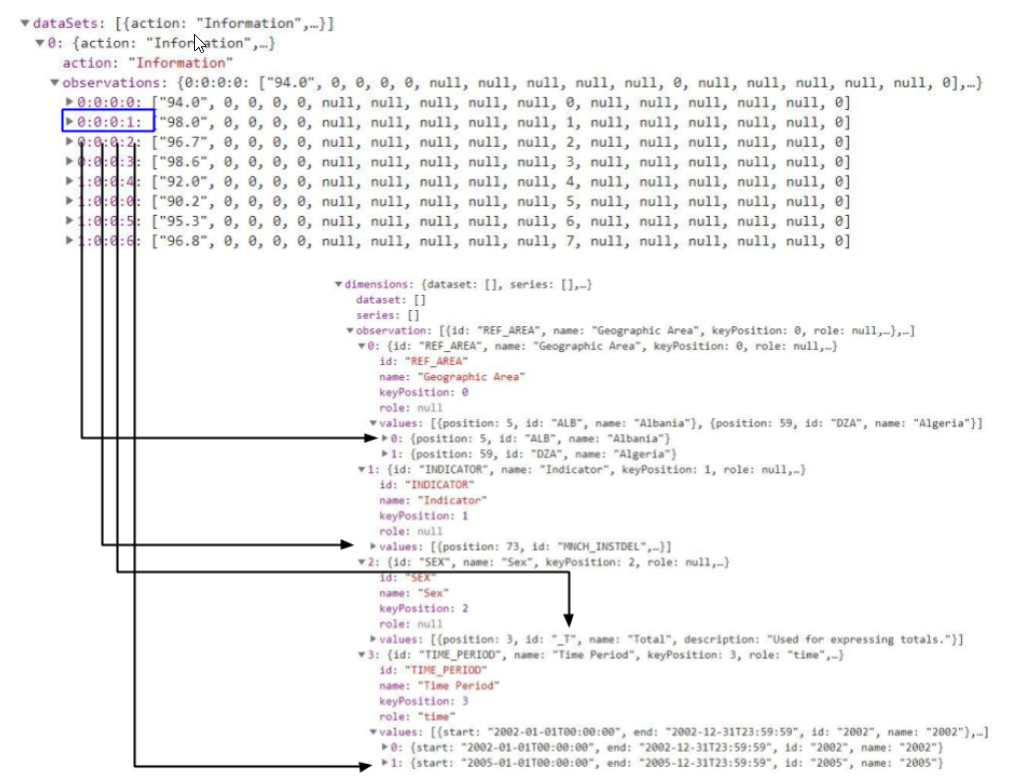
- In the example, the key 0:0:0:1 means Dim0=ALB, Dim1=MNCH_INSTDEL, Dim2=_T, Dim3=2005.
- The Actual observation in the example is 98.0 for Albania, MNCH_INSTDEL, Total sex, year 2005.
The Observation contains the value in the first position, the additional values are referring to the data point’s attributes. The link between the data point and the attributes is like the Dimensions: the position in the list matches the position in the list of attributes (+1 because the values are at the first position) the value identifies the position in list of values.
Tableau & Excel Connectors
- Fusion Registry to Tableau example via Fusion Web Data Connector https://sdmx.data.unicef.org/tableau/explorer.html
- Basic Demo of the Tableau Web Data Connector with an SDMX-JSON API Using Australian Bureau of Statistics Data https://aprince.github.io/ABS_SDMX-JSON_API/(no selection possible, connects to predefined set of data)

- Fusion Registry to Excel via FusionXL (FXL): FusionXL is a native Microsoft Excel add-in for Fusion Registry 8 and 9. The add-in connects Excel directly with a Fusion Registry service allowing browsing, creation and maintenance of structural metadata.
API calls cheat sheet
| Resource | Address |
| Dataflows | https://sdmx.data.unicef.org/ws/public/sdmxapi/rest/dataflow/all/all/latest/?format=sdmx-json&detail=full&references=none |
| Structure | https://sdmx.data.unicef.org/ws/public/sdmxapi/rest/data/AgencyId,DataflowId,Version/all?format=sdmx-json&detail=structureOnly
|
| Data download | https://sdmx.data.unicef.org/ws/public/sdmxapi/rest/data/AgencyId,DataflowId,Version/All?format=sdmx-json
|
| Partial data download | https://sdmx.data.unicef.org/ws/public/sdmxapi/rest/data/AgencyId,DataflowId,Version/DataQuery?format=sdmx-json
|