Progress on household drinking water, sanitation and hygiene, 2000-2020: Five years into the SDGs
The 2030 Agenda for Sustainable Development commits UN member states to take bold and transformative steps to ‘shift the world onto a sustainable and resilient path’, ‘realize the human rights of all’, ‘end poverty in all its forms’, and ensure ‘no one will be left behind’. Since 2000, billions of people have gained access to drinking water, sanitation and hygiene services, but many countries still have a long way to go to fully realize the Sustainable Development Goal (SDG) ambition to achieve ‘universal’ access ‘for all’. The WHO/UNICEF Joint Monitoring Programme for Water Supply, Sanitation and Hygiene (JMP) report Progress on household drinking water, sanitation and hygiene assesses current rates of progress and the prospects for achieving SDG targets by 2030.
Five years into the SDGs, the world is not on track to achieve SDG targets 6.1 and 6.2. Achieving universal coverage by 2030 will require a quadrupling of current rates of progress in safely managed drinking water services, safely managed sanitation services, and basic hygiene. Least Developed Countries have the furthest to go and it will be especially challenging to accelerate progress in fragile contexts. Many more countries are facing challenges in extending services to rural areas and to poor and vulnerable populations who are most at risk of being left behind.
1 in 4 people or 2 billion people around the world lack safe drinking water
In 2020, 74 per cent of the global population used safely managed drinking water services. National estimates were available for 138 countries and four out of eight SDG regions, representing 45 per cent of the global population. Coverage was lower in rural areas (60 per cent) than in urban areas (86 per cent), which were home to two out of three of the 5.8 billion people using safely managed services. By 2020 a total of 84 countries had achieved universal (>99 per cent) coverage of at least basic drinking water services.
Nearly half of the global population or 3.6 billion people lack safe sanitation
In 2020, 54 per cent of the global population (4.2 billion people) used safely managed sanitation services. National estimates were available for 120 countries and seven out of eight SDG regions, representing 81 per cent of the global population. Coverage was higher in urban areas (62 per cent) than in rural areas (44 per cent), and two thirds of the population using safely managed services lived in urban areas. Two thirds of those who still lacked even basic services lived in rural areas, nearly half lived in sub-Saharan Africa.
494 million people around the world still practise open defecation
The number of people practising open defecation globally decreased by 245 million between 2015 and 2020, with countries in Central and South Asia accounting for four out of five (196 million). Eastern and South Eastern Asia and Latin America and the Caribbean recorded reductions of 24 million and 10 million respectively. While most regions are on track to eliminate open defecation by 2030, sub-Saharan Africa is progressing too slowly and open defecation rates in Oceania have increased.
3 out of 10 people or 2.3 billion people around the world lack basic hygiene services
In 2020, 71 per cent of the global population (5.5 billion) had a basic handwashing facility with soap and water available at home. Another 21 per cent (1.6 billion) had handwashing facilities which lacked water or soap at the time of the survey, and 9 per cent (670 million) had no handwashing facility at all. Handwashing estimates were available for only four out of eight SDG regions and for 79 countries, representing 50 per cent of the global population, but few data were available for high-income countries.
Disaggregated data reveal huge disparities in service between and within countries
The SDG targets have an explicit focus on reducing inequalities but national, regional and global averages often mask significant inequalities in service levels between and within countries. For example, while three out of four people worldwide used safely managed drinking water services in 2020, regional coverage ranged from 96 per cent in Europe and Northern America to just 30 per cent in sub-Saharan Africa. Inequalities were even more pronounced among the 21 countries in sub-Saharan Africa, with national estimates ranging from 94 per cent in Reunion to just 6 per cent in Chad. The national average for Chad also masks a big gap in coverage between rural areas and urban areas, which were nine times more likely to have safely managed drinking water in 2020.
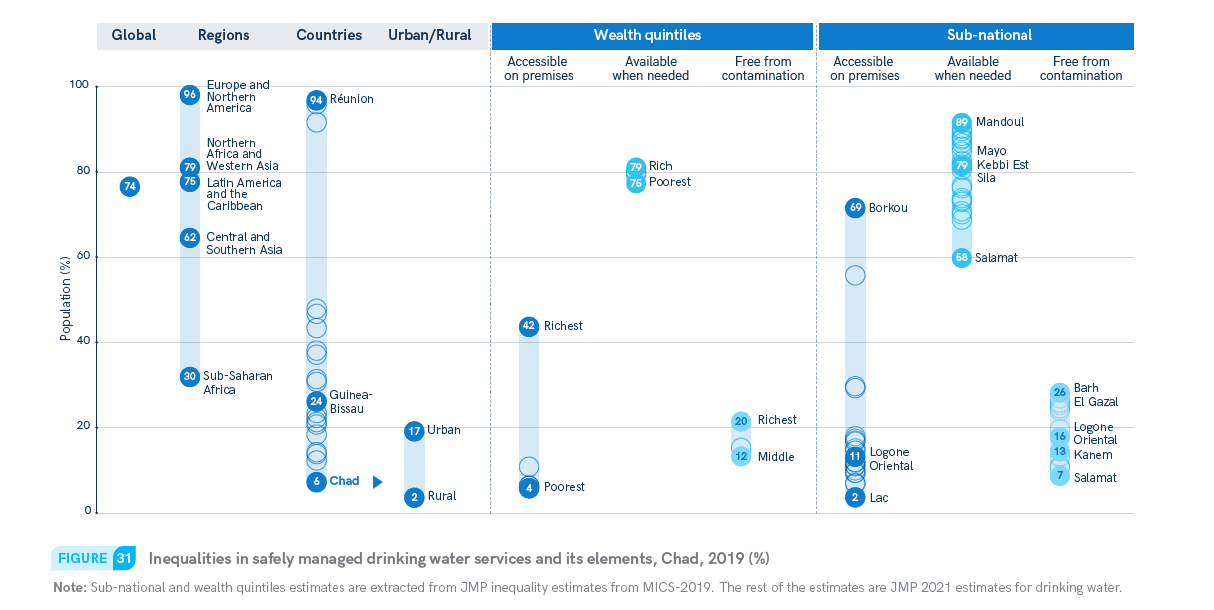
The Chad 2019 Multiple Indicator Cluster Survey (MICS) enables further analysis of sub-national inequalities in accessibility on premises, availability when needed, and drinking water quality (free from contamination). Disparities between the richest and poorest were relatively small for availability and quality but much larger for accessibility, with 42 per cent of the richest and just 4 per cent of the poorest having improved sources accessible on premises. There were also large disparities in accessibility between sub-national regions, ranging from 69 per cent on premises in Borkou to just 2 per cent in Lac.
Achieving SDG targets in fragile contexts will require a dramatic acceleration in current rates of progress
Fragility poses a major threat to the achievement of the SDGs. Fragile contexts were home to 23 per cent of the world’s population (1.8 billion people) and more than three quarters of those living in extreme poverty in 2020. People living in fragile contexts often have much lower WASH service levels and will need to be a major focus of efforts to accelerate progress towards the 2030 SDG targets.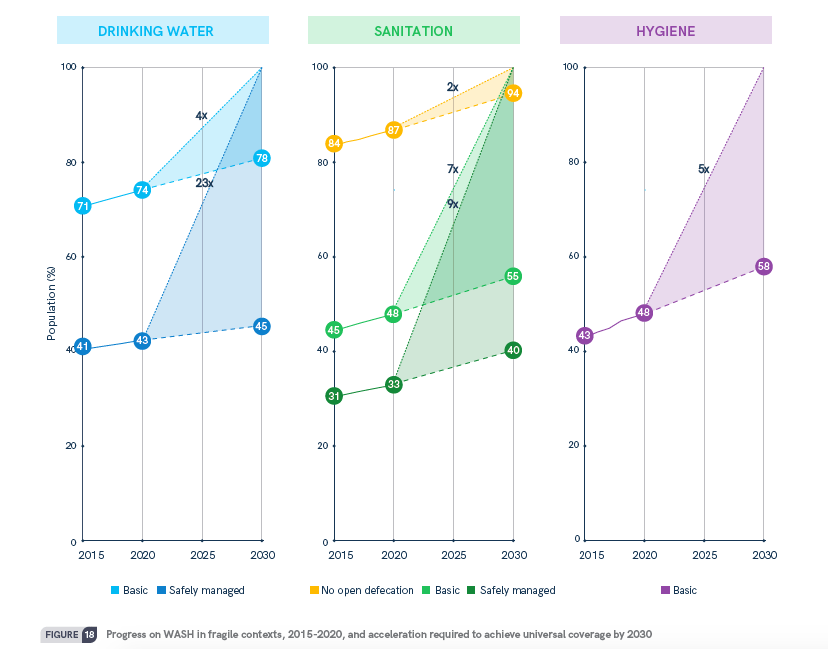
Over the first five years of the SDG period, basic drinking water coverage in fragile contexts has increased from 71 per cent in 2015 to 74 per cent in 2020. However, achieving universal access to basic drinking water will require a 4x increase in current rates of progress, while achieving universal access to safely managed drinking water will require a 23x increase. Fragile contexts have reduced open defecation from 16 per cent in 2015 to 13 per cent in 2020, but rates of progress will need to double to achieve elimination by 2030. Achieving universal access to basic sanitation will require a 7x increase, and achieving universal access to safely managed services will require a 9x increase. Coverage of basic hygiene services has increased from 43 per cent in 2015 to 48 per cent in 2020, but at current rates of progress only 58 per cent of the population living in fragile contexts will have access by 2030. Achieving the SDG target for hygiene in fragile contexts will require a 5x increase in current rates of progress.
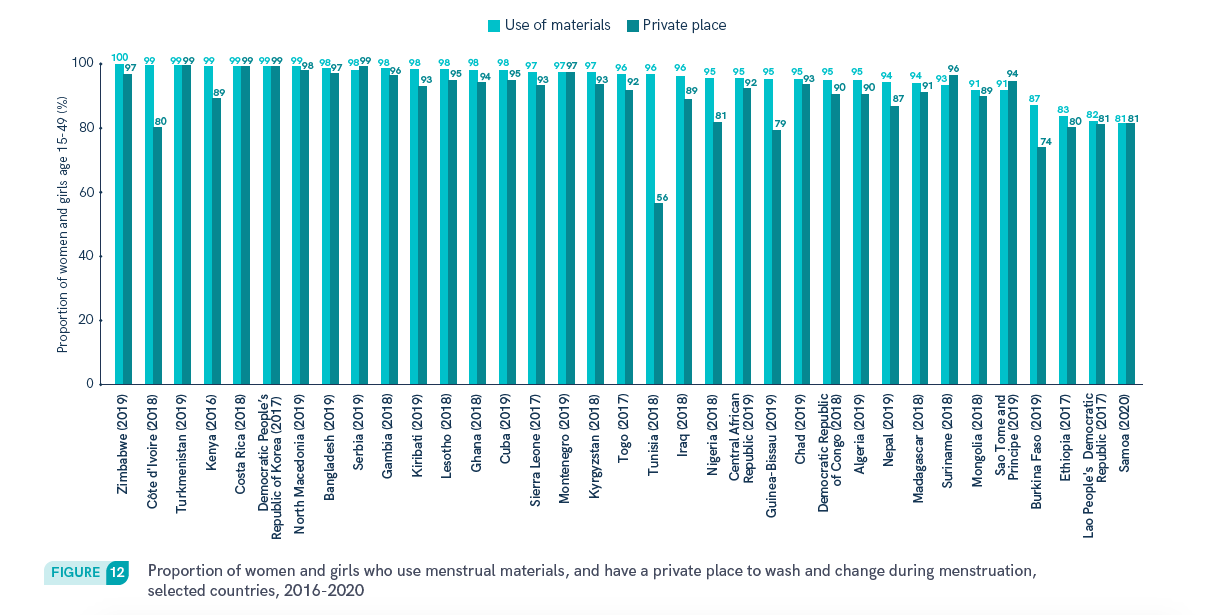
New data show that many women and girls do not have the services they need for menstrual health
SDG target 6.2 calls for ‘special attention to the needs of women and girls’ and WASH programmes are increasingly monitoring menstrual health related needs. The JMP has expanded its global database to include emerging national data on menstrual health. New indicators related to menstrual health and associated WASH service needs have been progressively included in household survey questionnaires for women and girls age 15 to 49, and can be grouped as follows:
- Awareness of menstruation before menarche (first menstruation).
- Use of menstrual materials to capture and contain menstrual blood, such as pads, cloths, tampons or cups. These can also be grouped into single-use and reusable materials.
- Access to a private place to wash and change while at home.
- Participation in activities during menstruation, such as school, work and social activities.
National data on the above menstrual health indicators have been collected from 42 countries. In many countries a significant proportion of women and girls do not have the services they need for menstrual health and there are often substantial disparities between population sub-groups, particularly between sub-national regions and for women and girls with and without disabilities.