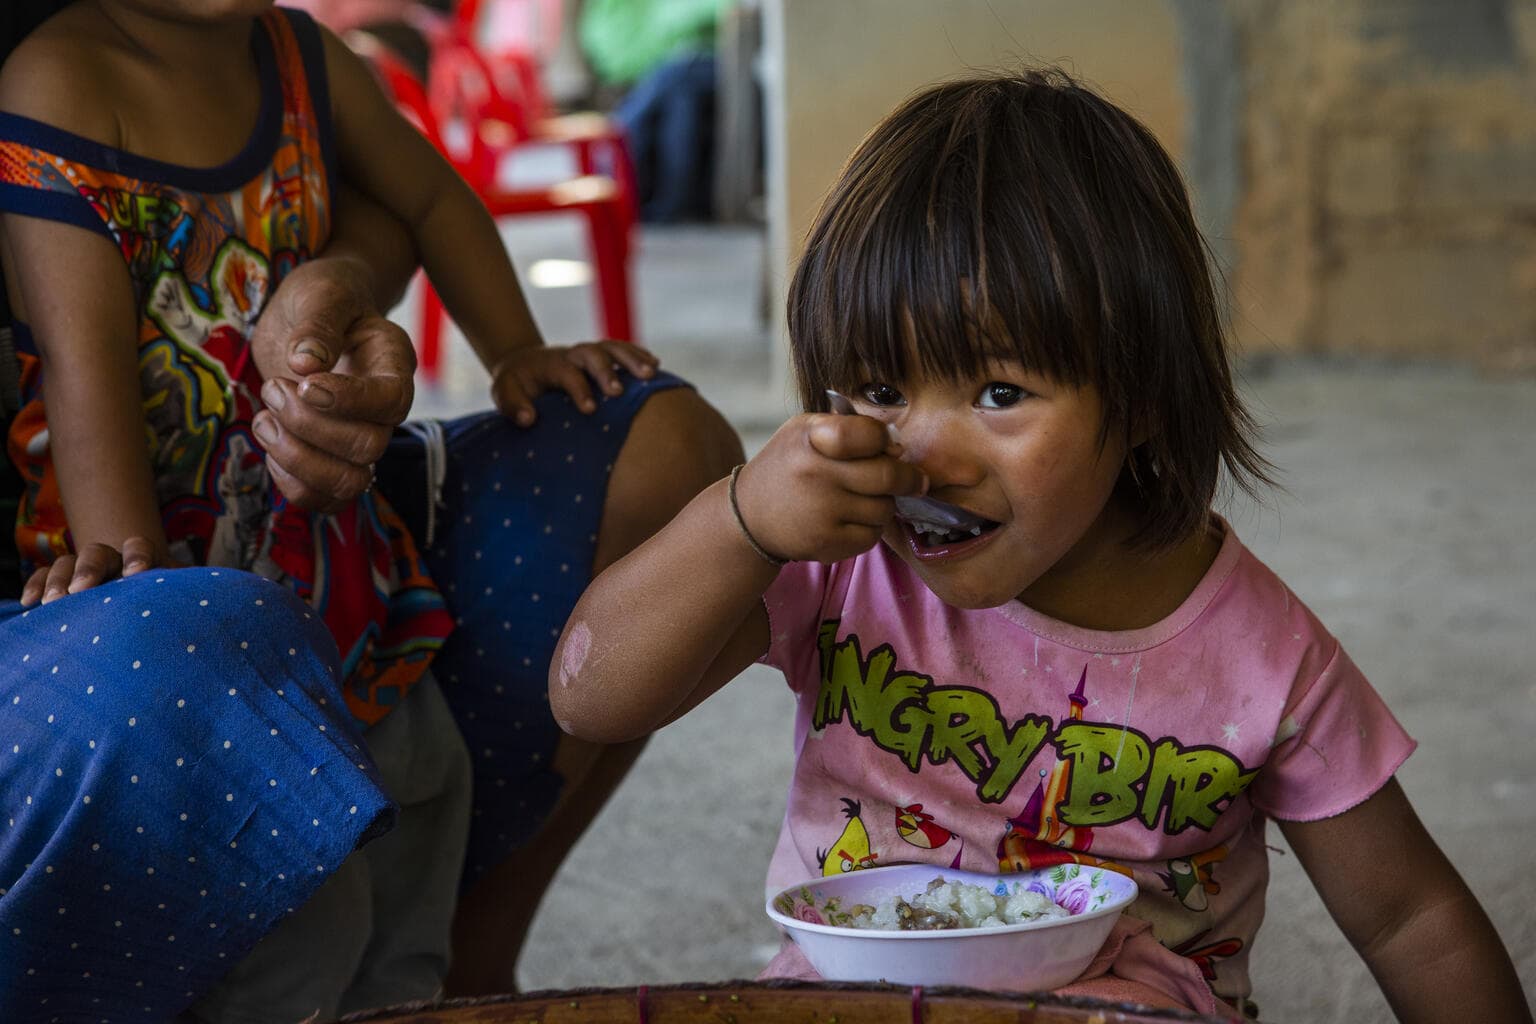
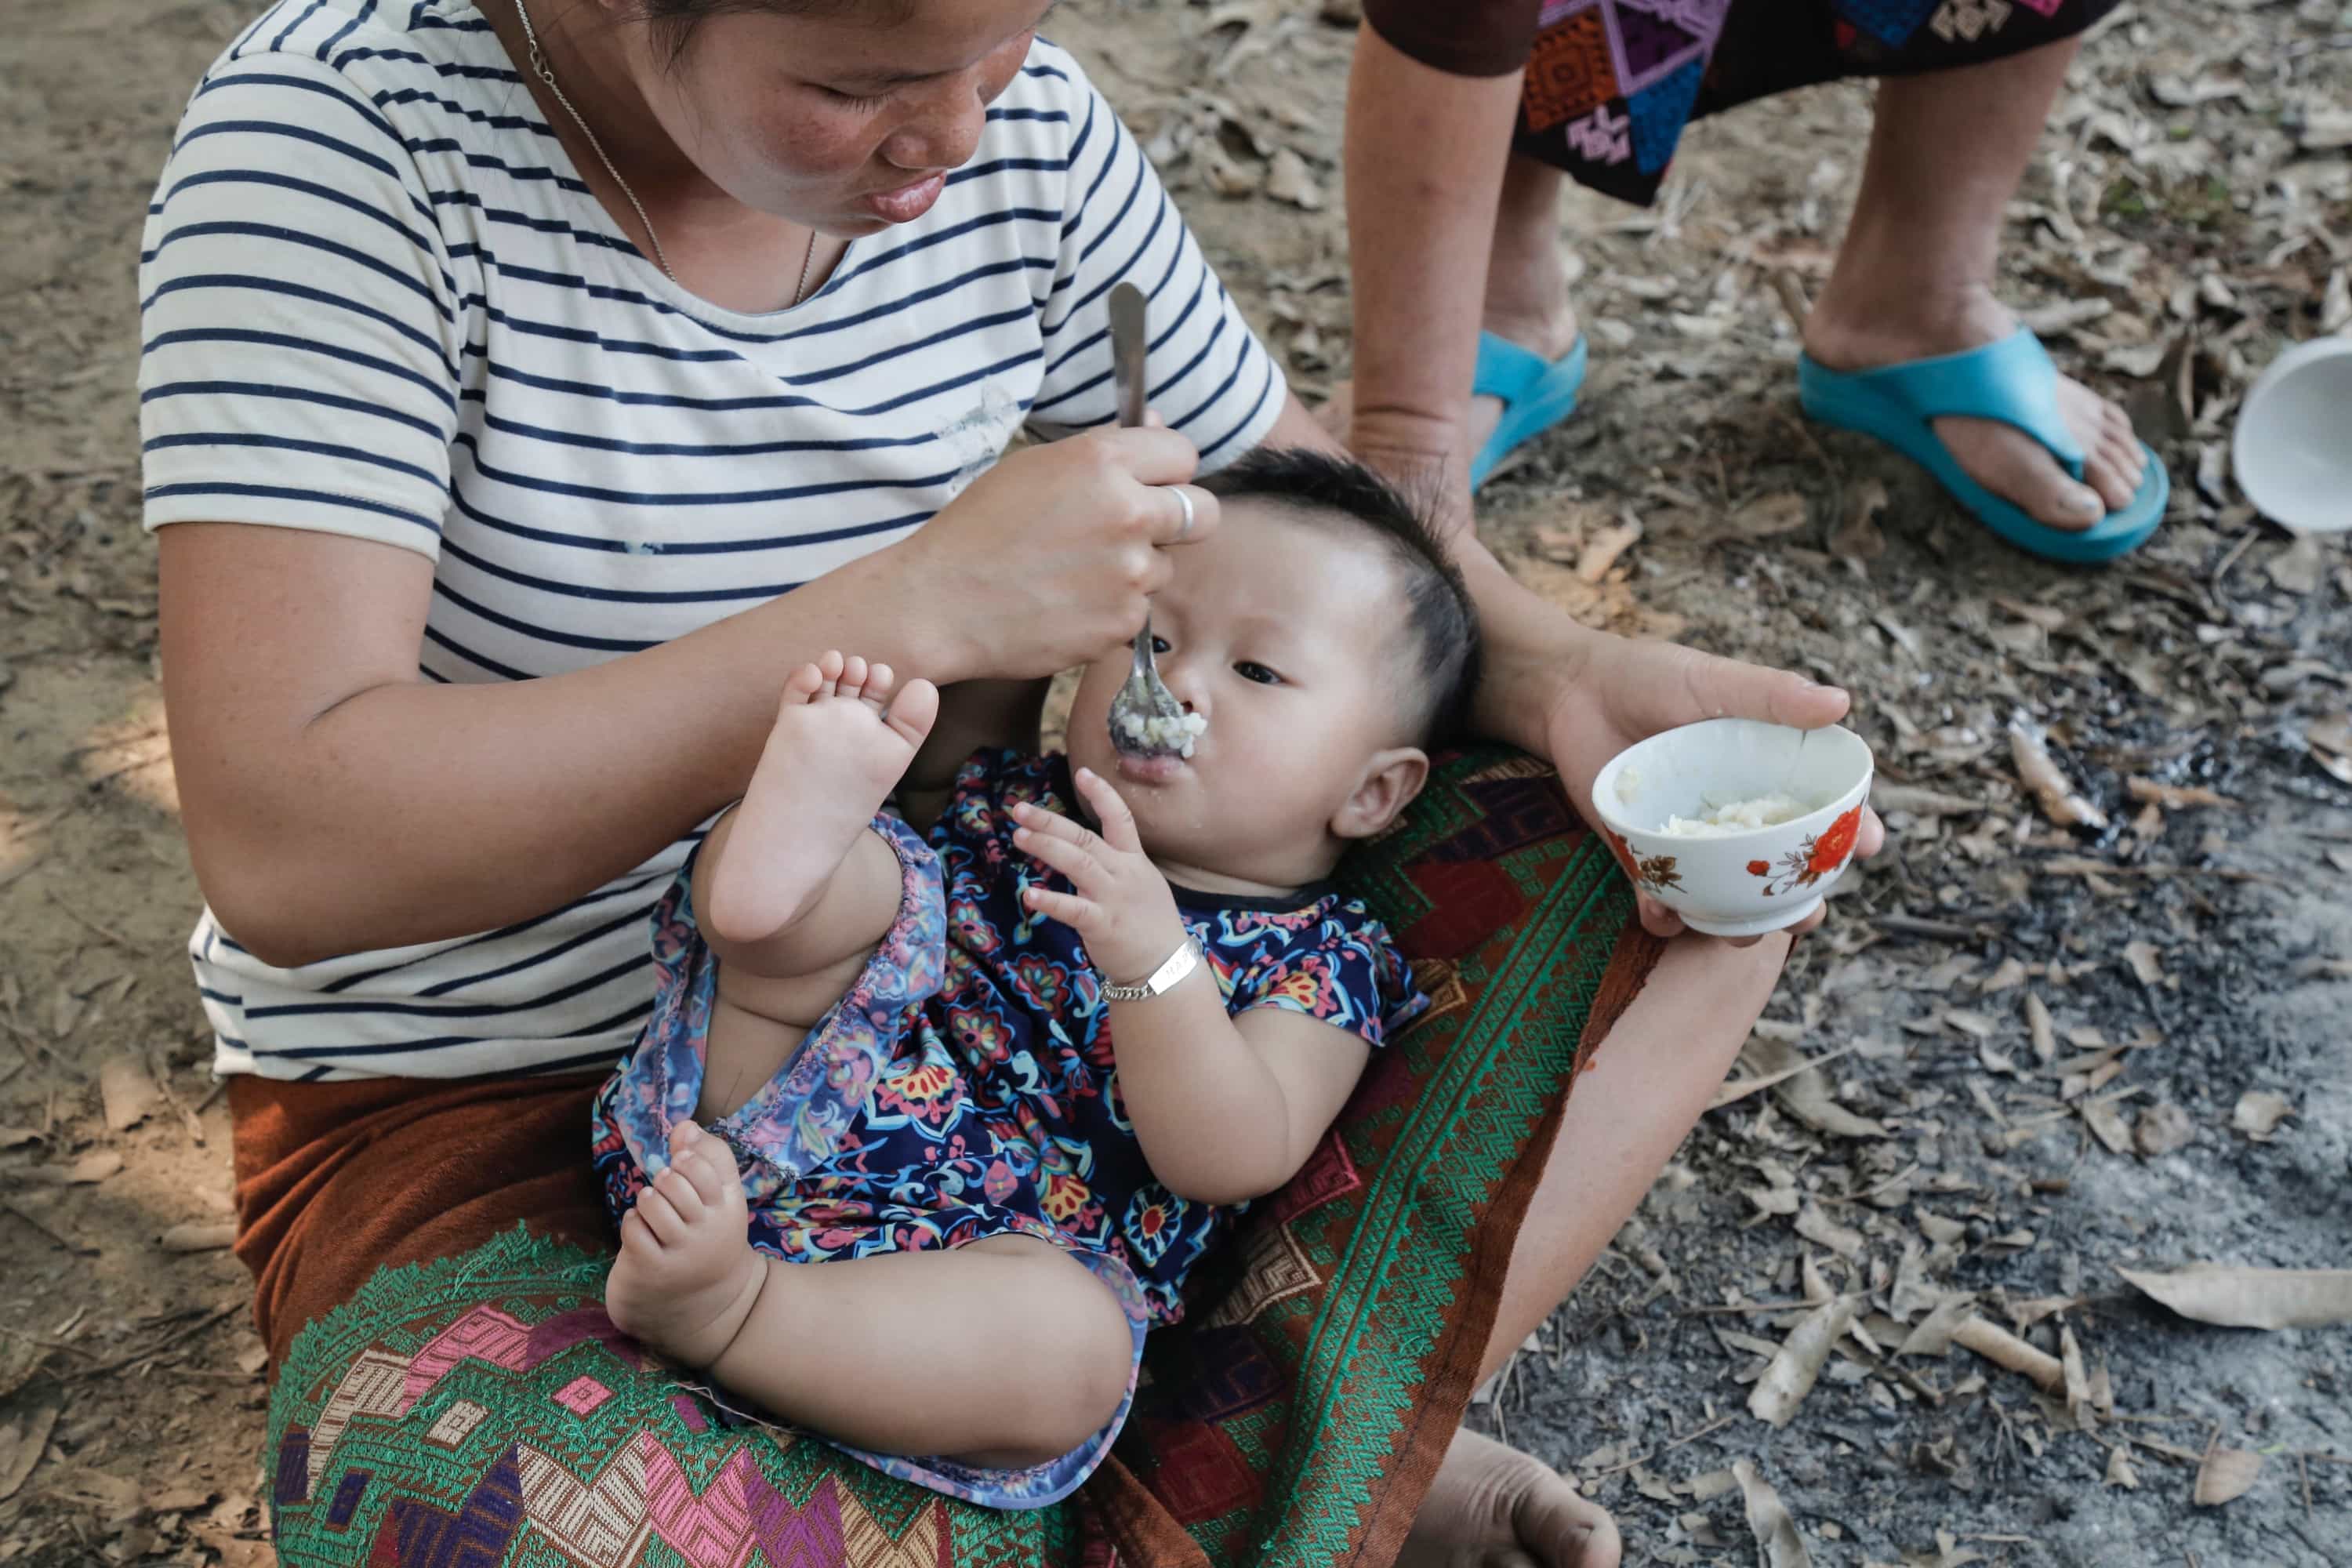
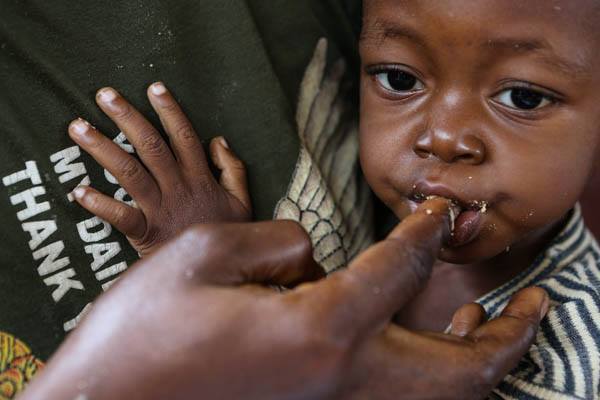
Child Malnutrition
Stunting has declined steadily since 2000 – but faster progress is needed to reach the 2030 target. Wasting persists at alarming rates and overweight will require a reversal in trajectory if the 2030 target is to be achieved
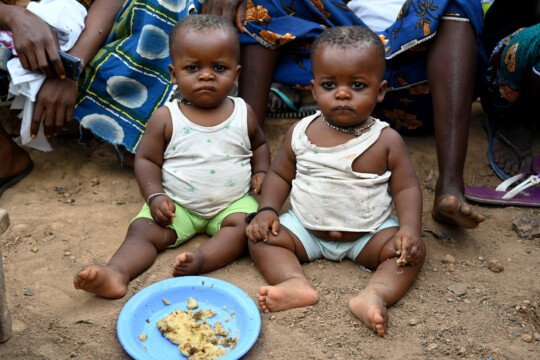
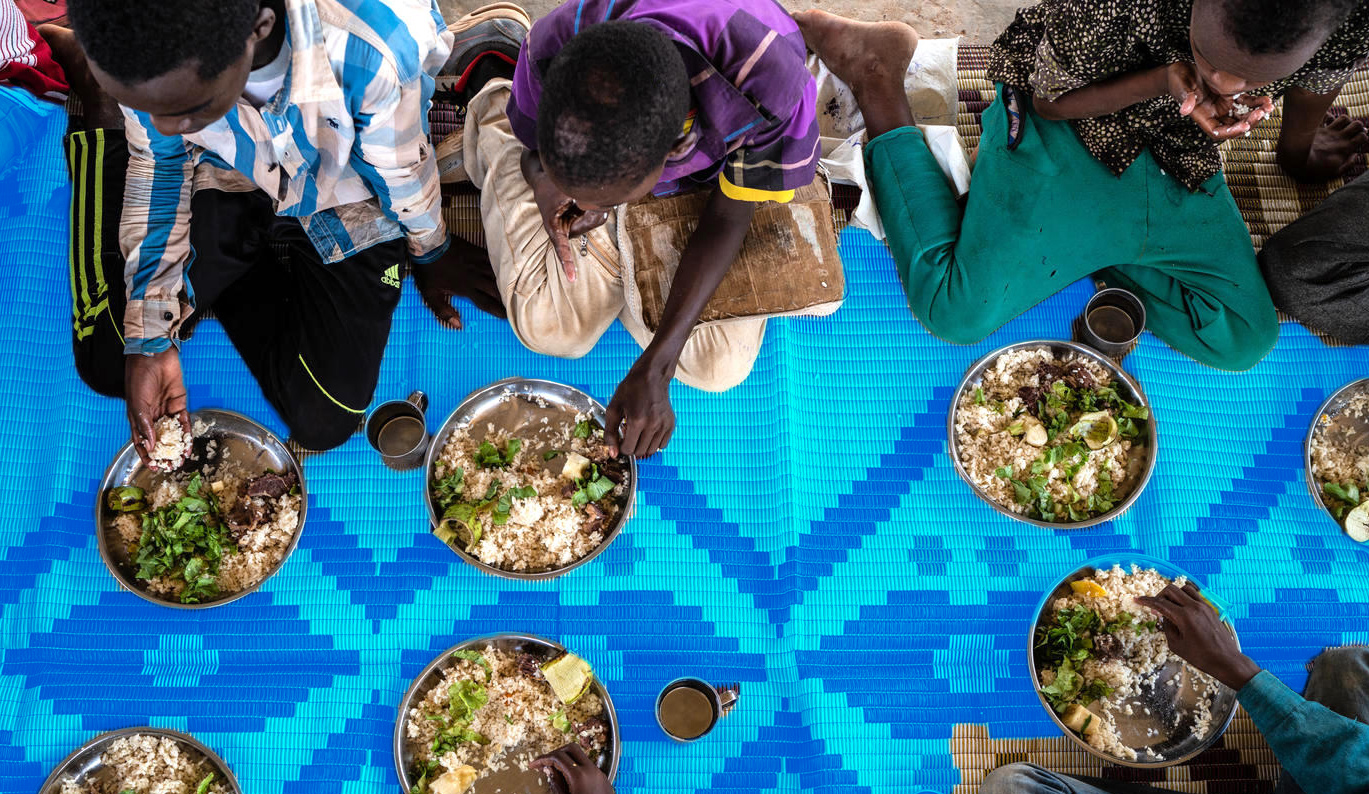
Nearly half of all deaths in children under 5 are attributable to undernutrition; undernutrition puts children at greater risk of dying from common infections, increases the frequency and severity of such infections, and delays recovery.
The interaction between undernutrition and infection can create a potentially lethal cycle of worsening illness and deteriorating nutritional status. Poor nutrition in the first 1,000 days of a child’s life can also lead to stunted growth, which is associated with impaired cognitive ability and reduced school and work performance.
We are still far from a world without malnutrition. While the 2023 edition of the UNICEF-WHO-World Bank Group Joint Malnutrition Estimates shows that stunting prevalence has been declining since the year 2000, more than one in five – 148.1 million children under 5 –were stunted in 2022, and at least 45.0 million suffered from wasting at any given point of time in the year. Meanwhile, the number of children under 5 affected by overweight worldwide has increased from 33.0 million in 2000 to 37.0 million in 2022.
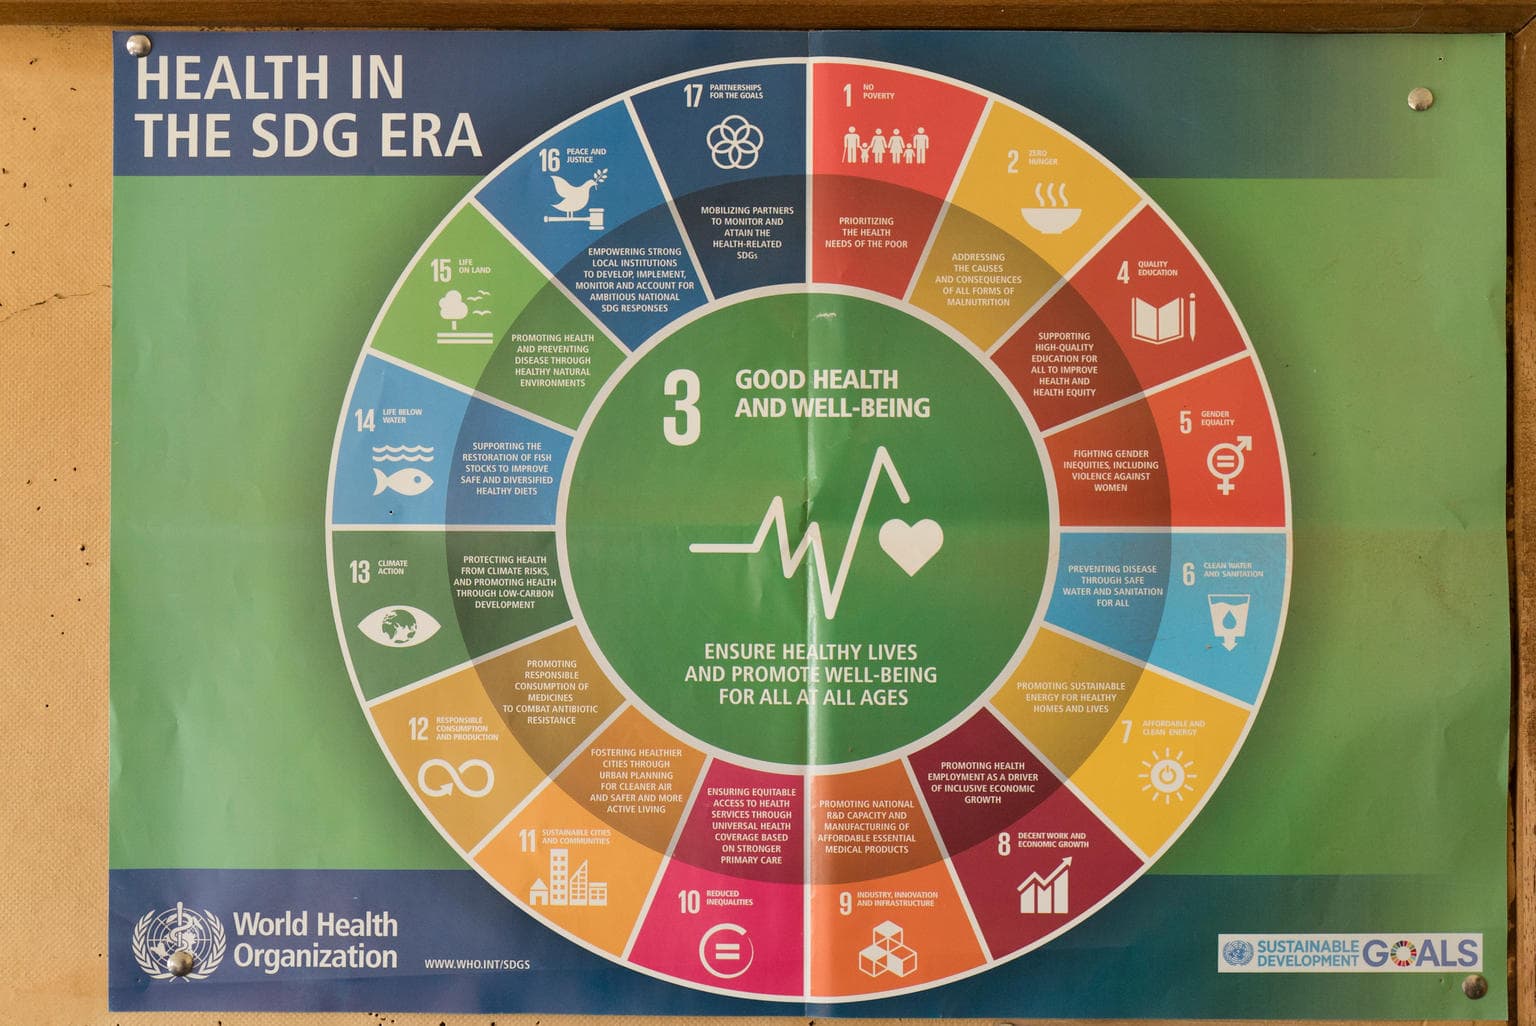
Measures of child malnutrition are used to track development progress. Estimates of child malnutrition will help determine whether the world is on track to achieve the Sustainable Development Goals – particularly, target 2.2, to “end all forms of malnutrition by 2030”, which falls under goal 2 to “end hunger, achieve food security and improved nutrition, and promote sustainable agriculture”.
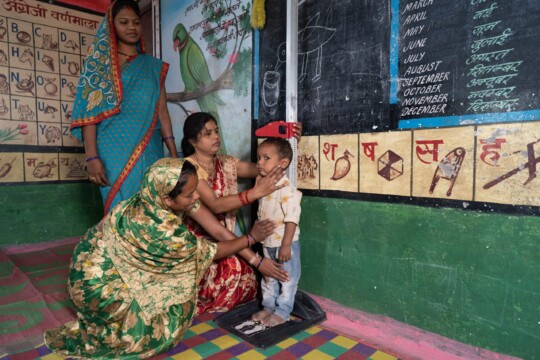
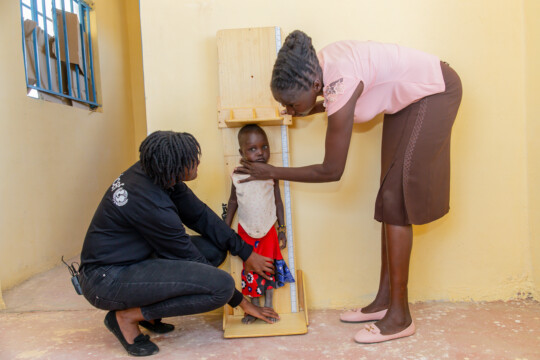
Stunting
In 2022, three regions had very high stunting prevalence, with approximately one third of children affected. On the other hand, two regions Europe and Central Asia and Northern America, had low stunting prevalence. However, vast disparities within regions can exist. In Latin America and the Caribbean, for example, despite the 11.5 per cent regional prevalence, some individual countries are faced with high, and very high stunting prevalence, while others have very low prevalence below 2.5 per cent. Chronic undernutrition in Latin America and the Caribbean can vary widely between neighboring countries: In one country less than 1 in 8 are affected, while more than 2 in 5 of their peers in the country next door are at a disadvantage due to the irreversible physical and cognitive damage that can accompany stunted growth.
In 2022, 22.3 per cent, or more than one in five children under age 5 worldwide had stunted growth. That said, overall trends are positive. Between 2000 and 2022, stunting prevalence globally declined from 33.0 per cent to 22.3 per cent, and the number of children affected fell from 204.2 million to 148.1 million. In 2022, nearly two out of five children with stunting lived in South Asia while another two out of five lived in sub-Saharan Africa.
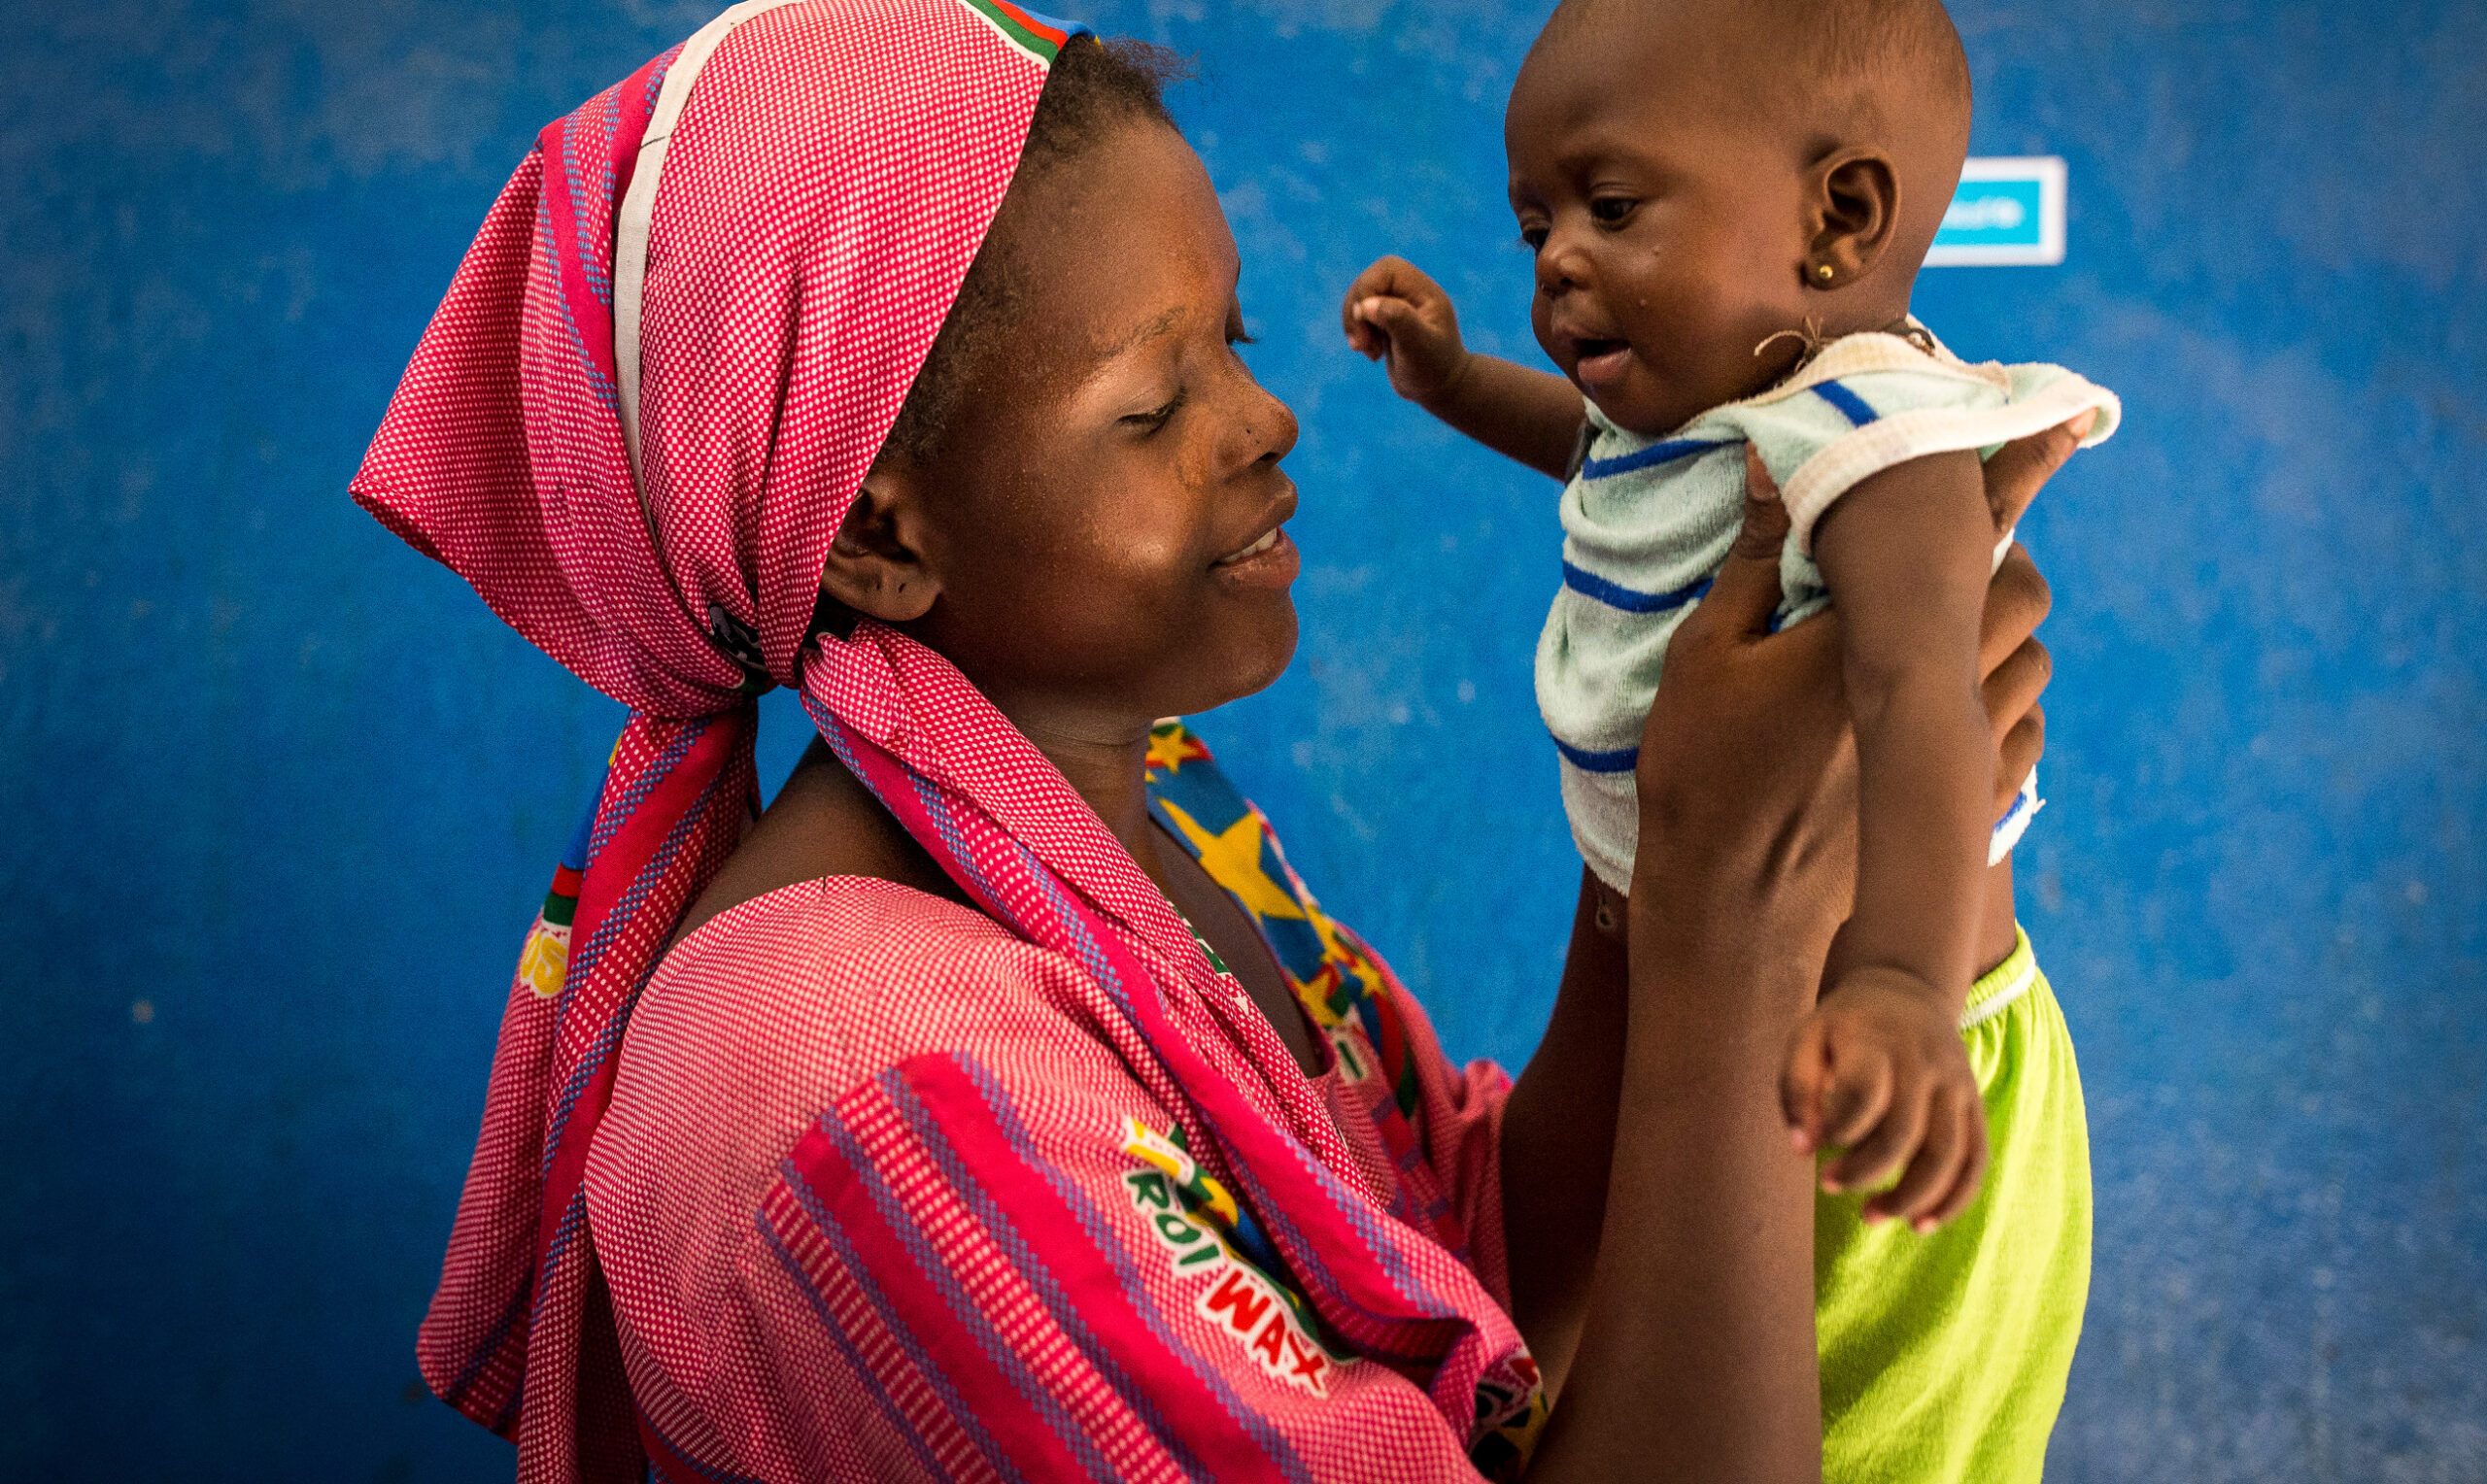
Wasting and severe wasting
Overweight
Middle East and North Africa had the highest overweight prevalence in 2022 with 10.3 per cent affected, followed by Latin America and Caribbean at 8.6%. The lowest overweight prevalence in 2022 was seen in South Asia at 2.7 per cent followed by West and Central Africa at 3.1 per cent. East Asia and the Pacific had the highest number of overweight children in 2022 with nearly 11 million affected, followed by Middle East and North Africa with an estimated 5.0 million overweight children under 5 years. Overall, these two regions account for just over 2 out of 5 children affected by overweight in the world.
References
Black, R.E., et al., Maternal and Child Undernutrition and Overweight in Low-income and Middle-income Countries, Lancet, vol. 382, no. 9890, 3 August 2013, pp. 427–451.
United Nations Children’s Fund (UNICEF), World Health Organization (WHO), International Bank for Reconstruction and Development/The World Bank. Levels and trends in child malnutrition: UNICEF / WHO / World Bank Group Joint Child Malnutrition Estimates: Key findings of the 2023 edition. New York: UNICEF and WHO; 2023.
Nutritional status
Malnutrition data
Build and download your own customisable dataset
Resources
Notes on the data
Indicators
|
Indicator name |
Definition |
||
|---|---|---|---|
|
Numerator |
Denominator |
Colloquial definition |
|
| Stunting | Number of under-fives falling below minus 2 standard deviations (moderate and severe) and minus 3 standard deviations (severe) from the median height-for-age of the reference* population | Children under 5 years of age in the surveyed population | Stunting refers to a child who is too short for his or her age. These children can suffer severe irreversible physical and cognitive damage that accompanies stunted growth. The devastating effects of stunting can last a lifetime and even affect the next generation. |
| Wasting | Number of under-fives falling below minus 2 standard deviations (moderate and severe) and minus 3 standard deviations (severe) from the median weight-for-height of the reference* population | Children under 5 years of age in the surveyed population | Wasting refers to a child who is too thin for his or her height. Wasting is the result of recent rapid weight loss or the failure to gain weight. A child who is moderately or severely wasted has an increased risk of death, but treatment is possible. |
| Overweight | Number of under-fives above 2 standard deviations from the median weight-for-height of the reference* population | Children under 5 years of age in the surveyed population | Overweight refers to a child who is too heavy for his or her height. This form of malnutrition results from energy intakes from food and beverages that exceed children’s energy requirements. Overweight increases the risk of diet-related noncommunicable diseases later in life. |
*The reference population is based on the WHO Child Growth Standards, 2006
Please note that some children can suffer from more than one form of malnutrition – such as stunting and overweight or stunting and wasting. There are currently no joint global or regional estimates for these combined conditions, but UNICEF has a country-level dataset with country level estimates, where re-analysis was possible.
1. Growth standard (reference population)
Prevalence children under 5 affected by stunting, wasting and overweight is estimated by comparing actual measurements to an international standard reference population. In April 2006, the World Health Organization (WHO) released the WHO Child Growth Standards to replace the widely used National Center for Health Statistics (NCHS)/WHO reference population, which was based on a limited sample of children from the United States of America. The new standards are the result of an intensive study project involving more than 8,000 children from Brazil, Ghana, India, Norway, Oman and the United States. Overcoming the technical and biological drawbacks of the old reference population, the new standards confirm that children born anywhere in the world and given the optimum start in life have the potential to reach the same range of height and weight. It follows that differences in children’s growth to age 5 are more influenced by nutrition, feeding practices, environment and health care than by genetics or ethnicity.
The new standards should be used in future assessments of child nutritional status. It should be noted that because of the differences between the old reference population and the new standards, prevalence estimates of child anthropometry indicators based on these two references are not readily comparable. It is essential that all estimates are based on the same reference population (preferably the new standards) when conducting trend analyses.
2. The Joint Malnutrition Estimates (JME) Methodology
The UNICEF-WHO-World Bank JME Working Group was established in 2011 to address the call for harmonized child malnutrition estimates that would be instrumental in benchmarking progress on child malnutrition. The first edition of the JME was released in 2012 and provided estimates for stunting, wasting, severe wasting, underweight and overweight, as well as a detailed description of the methodology (UNICEF & WHO, 2012). Since its inception, the JME outputs have comprised a harmonized country-level dataset of primary data (e.g., national estimates based on household surveys), as well as regional and global model-based estimates.
For the first time in 2021, the JME also includes country-level modelled estimates for stunting and overweight based on updated methodology (Mclain et al. 2019) developed by the JME Working Group in partnership with the University of South Carolina. The regional and global figures for stunting and overweight are now also based on these country model outputs, while they remain based on the previously applied sub-regional model for wasting and severe wasting (UNICEF & WHO, 2012). Additional work is ongoing to update methods for wasting and severe wasting for which available data are not as stable as for stunting and overweight. The JME process for the 2021 edition involved the following steps: (i) updating of the country dataset of primary sources (e.g., national household surveys); (ii) application of a country level model for stunting and overweight to generate annual estimates; (iii) generation of regional and global aggregates for stunting, wasting, severe wasting and overweight; and (iv) consultation with countries before finalizing and disseminating the 2021 estimates. These parts of the JME are described in more detail below.
2.1 The JME dataset of country estimates
The JME dataset of country estimates requires the collection of national data sources that contain information on child malnutrition, specifically that collected data on the height, weight and age of children under 5, which can be used to generate national-level prevalence estimates for stunting, wasting, severe wasting and overweight. These national-level data sources are mainly comprised of household surveys – e.g., Multiple Indicator Cluster Surveys (MICS), Demographic and Health Surveys (DHS), Standardized Monitoring and Assessment of Relief and Transition (SMART) surveys, and Living Standards Measurement Study (LSMS). Some administrative data sources (e.g., from surveillance systems) are also included where population coverage is high. As of the latest review closure on 31 January 2021, the primary source dataset contained 997 data sources from 157 countries and territories, with nearly 80 per cent of children living in countries with at least one data point on stunting, wasting and overweight that is less than 5 years old.
The dataset contains the point estimate, and where available, the standard error, the 95 per cent confidence bounds and the unweighted sample size. Where microdata are available, the JME uses estimates that have been recalculated to adhere to the global standard definition (UNICEF & WHO, 2019). Where microdata are not available, reported estimates are used, except in cases where adjustments are required to standardize for: (i) use of an alternate growth reference from the 2006 WHO Growth Standards; (ii) age ranges that do not include the full 0–59-month age group; and (iii) data sources that were only nationally representative for populations residing in rural areas. Further details related to data source compilation, re-analysis of microdata, and data source review are provided elsewhere (UNICEF & WHO, 2020).
2.2 Country-level model for stunting and overweight estimates
2.2.1 Rationale
National surveys are administered sporadically, resulting in sparse data for many countries. This hampers efforts to monitor the countries’ progress towards targets, such as the SDG targets. The use of statistical models at country level is important to enable comparisons across countries at the same year, filling in the gaps. In addition, statistical models are an efficient way to adjust for unwarranted variability.
2.2.2 Model description
The technical details of the statistical models are provided elsewhere (UNICEF & WHO, 2020). modeled at logit (log-odds) scale using a penalized longitudinal mixed-model with a heterogeneous error term. The quality of the models was quantified with model-fit criteria that balance the complexity of the model with the closeness of the fit to the observed data. The proposed method has important characteristics, including non-linear time trends, regional trends, country-specific trends, covariate data and a heterogeneous error term. All countries with data contribute to estimates of the overall time trend and the impact of covariate data on the prevalence. For overweight, the covariate data consisted of linear and quadratic socio-demographic index (SDI)**, and data source type. The same covariates were used for stunting, plus an additional one of the average health system access over the previous five years (UNICEF & WHO, 2020).
2.2.3 Model outputs
Annual country-level modelled estimates from 2000 to 2020 on stunting and overweight were disseminated by the JME in 2021 for 155 countries with at least one data point (e.g. from a household survey) included in the country dataset of primary sources described in section 2.1 above. Modelled country estimates were also produced for an additional 49 countries, used solely for generation of regional and global aggregates. Modelled estimates for these 49 countries are not shown because they did not have any household surveys in the JME country dataset or because the modelled estimates remained pending final review at the time of publication. The results for the 204 countries can be used to calculate estimates and uncertainty intervals for any groups of countries aggregated. The uncertainty intervals are important in monitoring trends, especially for countries with sparse data and where primary data sources present large primary data source sampling errors (SSE). When only sparse data are available in the most recent period, the inclusion of a survey can affect a substantial change in the predicted trajectory. For this reason, uncertainty intervals are needed to enhance trend interpretability in terms of the caution level employed. The uncertainty intervals for the new JME method have been tested and validated with various data types.
2.3 Generation of regional and global estimates
Different methods were applied to generate regional and global estimates for stunting and overweight compared to wasting and severe wasting for the 2021 edition of the JME as described below. In short, results from the new country-level model were used to generate the regional and global estimates for stunting and overweight, while the JME sub-regional multi-level model (UNICEF & WHO, 2012, de Onis et al. 2004), was used to generate the global and regional estimates for wasting and severe wasting.
2.3.1 Stunting and overweight:
Global and regional estimates for all years from 2000 to 2020 were derived as the respective country averages weighted by the countries’ under-5 population from The United Nations World Population Prospects, 2019 Revision, using model-based estimates for 204 countries. This includes 155 countries with national data sources (e.g. household surveys) included in the JME country dataset described in section 2.1 above. It also includes 49 countries with modelled estimates generated for development of regional and global aggregates but for which country modelled estimates are not shown because they did not have any household surveys in the JME country dataset or because the modelled estimates remained pending final review at the time of publication. Confidence intervals were generated based on bootstrapping methodology.
2.3.2 Wasting and severe wasting:
The wasting and severe wasting prevalence data from national data sources described in se section 2.1 above were used to generate the regional and global estimates for the year 2020 using the JME sub-regional multi-level model (UNICEF & WHO, 2012, de Onis et al. 2004), applying population weights for children under 5 years of age from The United Nations World Population Prospects, 2019 Revision.
2.4 Country Consultations
For the estimates presented in the 2021 edition of the JME, joint UNICEF-WHO country consultations were conducted from November 2020 to January 2021. The purpose of these consultations was to explain the updated methodology for stunting and overweight estimates to national governments; to ensure the estimates included all recent and relevant country data for stunting, wasting and overweight; and to engage with and receive feedback from national governments on the estimates.
3. Other notes on the Joint Malnutrition Estimates
3.1 Explanation as to why trends are shown for stunting and overweight but only most current estimate for wasting and severe wasting:
The JME on wasting and severe wasting are based on national-level prevalence data alone and thus do not reflect the cumulative cases (incidence) that occur over the course of a year (Isanaka et al 2021). Wasting is a relatively short-term condition, which means that an individual child can be affected more than once in a calendar year (i.e., can recover but then become wasted again in the same year). The global prevalence-based estimates of 45.4 million children under 5 affected by wasting and 13.6 million affected by severe wasting in 2020 should therefore be viewed as an underestimate of the number of children affected and in need of treatment that year.
Wasting is also affected by seasonality, meaning that prevalence may vary greatly between the pre-harvest season (which is often associated with food shortages, heavy rains and related diseases that can affect nutrition status) and the post-harvest season (which is often associated with higher food availability and weather patterns that are less likely to cause disease). Yet the country data that feed into the JME can be collected during any season. This means that prevalence for any given survey might be at a high or low; or it may fall somewhere in between if data are collected across seasons.
The lack of incidence data for wasting and severe wasting is a main reason why the JME does not present annual trends for these forms of malnutrition. Since the prevalence data are collected infrequently (every 3 to 5 years) in most countries and measure wasting at one point in time, it is not possible to capture the rapid fluctuations in wasting over the course of a given year or to adequately account for variations in seasons across survey years. In contrast, stunting and overweight are relatively stable over the course of a calendar year, making it possible to track changes in these two conditions over time with prevalence data.
3.2 Footnotes on population coverage
As started in the 2014 edition, a separate exercise was conducted to assess population coverage for the modelled global and regional estimates. This was important in order to alert the reader, via footnotes, to instances where estimates for some regions and years should be interpreted with caution due to low population coverage (defined as less than 50 per cent). A conservative method was applied looking at available data within mutually exclusive five-year periods around the projected years. Population coverage was calculated as:

Estimates are flagged as having consecutive low population coverage when at least two five-year periods in a row (e.g., when the assessment for 2000-2004 as well as the assessment for 2005-2009 both yield population coverage below 50 per cent).
3.3 Prevalence thresholds for wasting, overweight and stunting in children under 5 years
New thresholds, presented in the table below, were established through the WHO-UNICEF Technical Advisory Group on Nutrition Monitoring (de Onis et al. 2018) and have been used for development of prevalence-based maps. The thresholds were developed in relation to standard deviations (SD) of the normative WHO Child Growth Standards. The international definition of ‘normal’ (two SD from the WHO standards median) defines the first threshold, which includes 2.3% of the area under the normalized distribution. Multipliers of this “very low” level (rounded to 2.5%) set the basis to establish subsequent thresholds.
Prevalence thresholds (%) for severity of malnutrition among children under 5 years
| Labels | Prevalence thresholds (%) for: | ||
| Wasting | Overweight | Stunting | |
| Very low | <2.5 | <2.5 | <2.5 |
| Low | 2.5 – <5 | 2.5 – <5 | 2.5 – <10 |
| Medium | 5 – <10 | 5 – <10 | 10 – <20 |
| High | 10 – <15 | 10 – <15 | 20 – <30 |
| Very high | ≥15 | ≥15 | ≥30 |
3.4 Estimating country-level progress
Country-level progress in reducing malnutrition prevalence is evaluated by calculating the actual average annual rate of reduction (AARR) achieved by the country “to date”, and comparing this to the AARR needed in order to achieve target. For more information about how to calculate country-level AARR, please click here to read a technical note. A Nutrition Targets Tracking Tool which provides AARR levels for different scenarios is also available to investigate progress towards the 2025 World Health Assembly (WHA) nutrition targets for each country.
Footnotes
**SDI is a summary measure that identifies where countries or other geographic areas sit on the spectrum of development. Expressed on a scale of 0 to 1, SDI is a composite average of the rankings of the incomes per capita, average educational attainment, and fertility rates of all areas in the Global Burden of Disease study.
References
de Onis M, Blossner M, Borghi E, Morris R, Frongillo EA. Methodology for estimating regional and global trends of child malnutrition. International Journal of Epidemiology 33:1260-1270.
de Onis, M., et al. (2018). Prevalence thresholds for wasting, overweight and stunting in children under 5 years. Public health nutrition, 22(1), 175–179.
Isanaka S, Andersen CT, Cousens S, et al. Improving estimates of the burden of severe wasting: analysis of secondary prevalence and incidence data from 352 sites. BMJ Glob Health. 2021;6(3):e004342. doi:10.1136/bmjgh-2020-004342.
McLain AC, Frongillo EA, Feng J, Borghi E. Prediction intervals for penalized longitudinal models with multisource summary measures: an application to childhood malnutrition. Statistics in Medicine 38:1002-1012, 2019.
United Nations Children’s Fund, World Health Organization, The World Bank. UNICEF-WHO-World Bank Joint Child Malnutrition Estimates. (UNICEF, New York; WHO, Geneva; The World Bank, Washington, DC; 2012).
UNICEF & WHO 2019. Recommendations for data collection, analysis and reporting on anthropometric indicators in children under 5 years old. Geneva: World Health Organization and the United Nations Children’s Fund (UNICEF), 2019. Licence: CC BY-NC-SA 3.0 IGO. Accessed online 23 October 2021, url: < https://data.unicef.org/resources/data-collection-analysis-reporting-on-anthropometric-indicators-in-children-under-5/>
UNICEF-WHO-World Bank 2020. SDG Indicators 2.2.1 on stunting, 2.2.2a on wasting and 2.2.2b on overweight: Country consultation background document for 2021 edition of the Joint Malnutrition Estimates. (also available at: https://data.unicef.org/resources/jme-2021-country-consultations/)